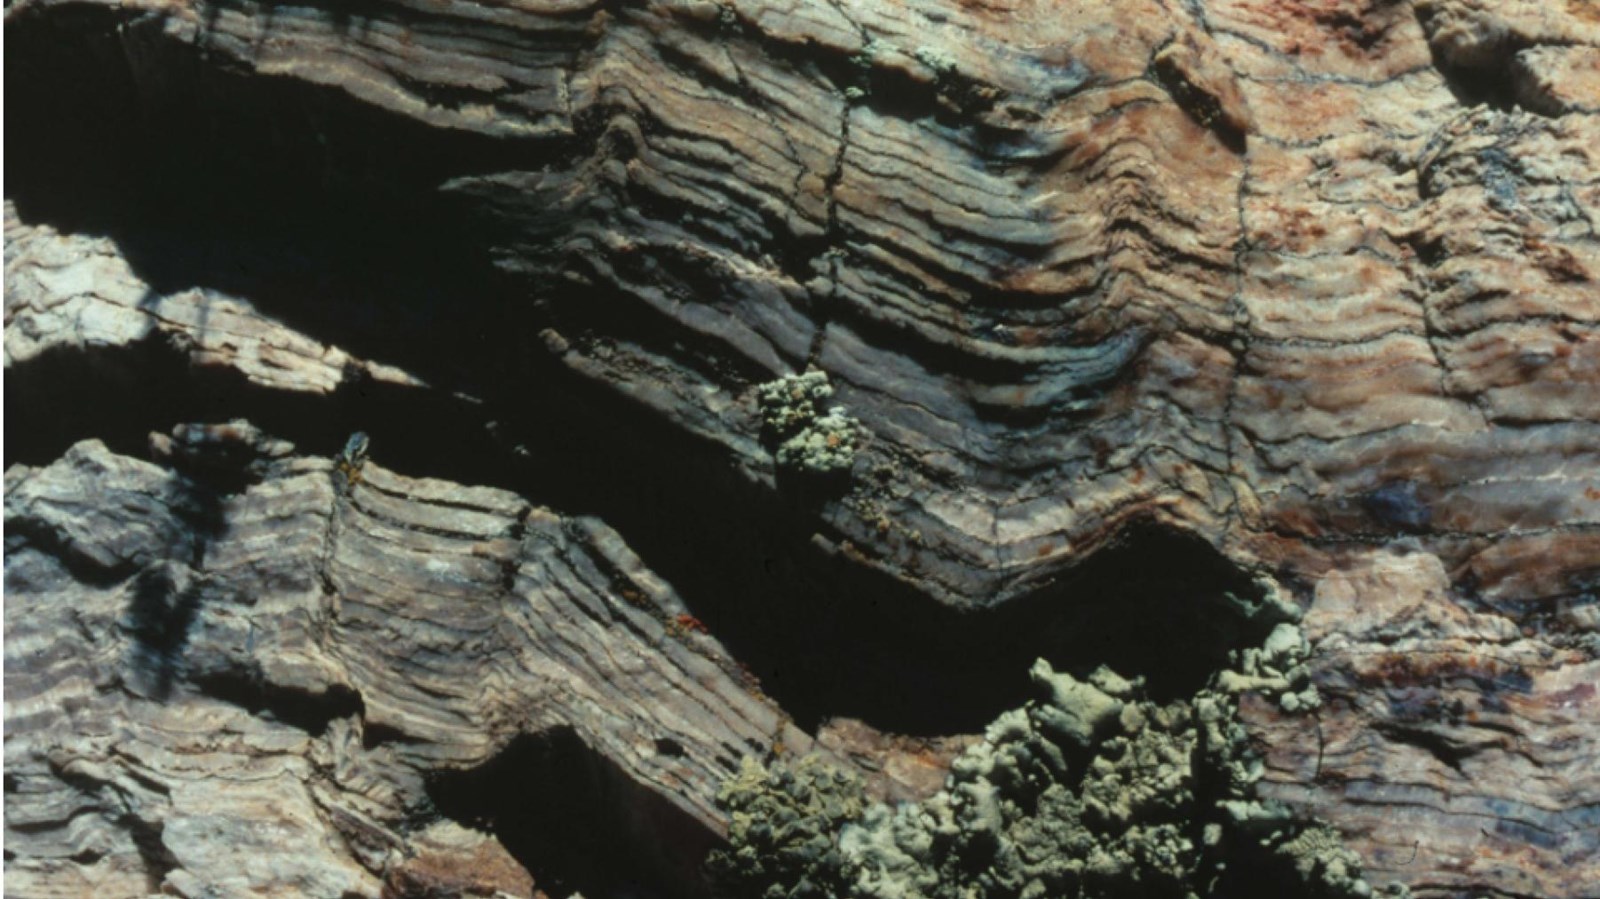
At Florissant in Colorado, the rings of a petrified stump still curve through the stone. The tree grew in the late Eocene, about 34 million years ago; mineral preservation has carried its wood structure into the present.[1] The photograph below makes the attraction of fossil wood immediately clear. Here is a sequence you can follow with your eye, moving through successive episodes of growth inside a single organism.
Reading that sequence requires a second kind of attention. A narrow interval establishes that little wood accumulated there. Explaining why means placing the tree back among its neighbors, soils, and seasons.
What the boundary records
In seasonally growing trees, wood formation changes as the growing season proceeds. Earlywood commonly has thinner cell walls; latewood has thicker walls. Together they produce the familiar banding visible across a trunk. Older growth lies toward the center, younger growth toward the bark. The width of an increment measures how much the tree expanded radially during that interval.[2]
That measurement records the outcome of growth. Water shortage, disease, and other unfavorable conditions can all reduce it.[2] A narrow band therefore starts an investigation: which constraint mattered here? Even before considering deep time, the same-looking mark can have several biological explanations.
Counting brings its own problem. Modern trees can produce an extra apparent ring when conditions change within a year, or fail to produce a recognizable ring during exceptionally poor growth. Dendrochronologists compare overlapping patterns among trees to identify these irregularities. This crossdating is what gives a chronology its strength.[3]
The distinction matters for fossils. Counting a sequence can estimate the growth seasons preserved in the sampled wood, provided annual formation is justified. Assigning those seasons to calendar years requires a dated reference sequence. A beautifully preserved ring does not supply that connection by itself. A fragment also need not preserve the tree's entire life: the center or the outer wood may be missing.[3]
How far can a width travel?
The tempting next step is to turn millimeters into climate. Howard Falcon-Lang tested that ambition in a 2005 study using modern tree-ring data from 727 sites. He examined average ring width, the variability between successive rings, and the proportion of latewood. Tree responses varied substantially with taxonomic identity, age, ecology, and environment.[4]
He argued that quantitative interpretations needed large samples and control over those competing influences. He explicitly preserved a role for qualitative interpretation.[4] Fossil growth rings can help establish the character of an environment even where they cannot justify a precise temperature estimate.
This changes what makes a useful collection. Another trunk is valuable because it offers another biological response to compare. Agreement among appropriate samples strengthens an environmental interpretation; disagreement may reveal differences within the forest. The unit of observation is one tree, while the proposed explanation may concern an entire region. Crossing that distance requires evidence.[4]
A tree that struggled in a flourishing forest
An Antarctic stem makes the problem tangible. Decombeix and colleagues described it in 2024. From the Helliwell Formation, about 240 million years old, its roughly six-centimeter diameter contained more than 120 rings. The authors interpreted these as annual increments, averaging about 0.2 millimeters wide.[5]
Microscopic sections supported its identification as a conifer. Yet other fossil woods and the sedimentary setting indicated generally favorable regional growing conditions. The authors interpreted the specimen as a dwarf tree whose growth had been suppressed locally. Competition, shading, or unfavorable soil conditions could explain its predicament; the fossil does not identify a unique cause.[5]
The comparison is the discovery. Without the surrounding evidence, those crowded rings might encourage a story of regional hardship. With it, they preserve the possibility of an individual struggling in a productive forest.
When a statistic becomes too persuasive
One commonly used measure, mean sensitivity, summarizes relative changes in width between neighboring rings. It describes how unevenly a tree grew from one interval to the next. Marc Philippe's 2023 assessment compiled 63 studies using the measure for paleoclimatic interpretation and found substantial problems with treating its values as climate labels.[6]
Measurements could differ between researchers studying the same fossil, and between radii measured through the same piece of wood. Across the compiled material, the values formed a continuous distribution, undermining attempts to divide them into discrete climate categories. Philippe also emphasized that a tree's local growing conditions cannot simply stand for regional or global climate.[6]
A calculation can be reproducible without having a unique environmental explanation. In practice, that means checking where measurements were made, how the wood was sampled, and whether the surrounding geology supports the proposed interpretation. The statistic should sharpen a question that the specimens can answer.[6]
Return to the Florissant photograph and the rings become more interesting. Their survival preserves a sequence of growth; comparison gives that sequence ecological meaning. The task is to discover how much of the wider world passed through this particular tree—and how much of its record belonged to the place where it stood.
Sources
- National Park Service, “Learning from Tree Rings” — Florissant fossil wood, Eocene context, and photograph.
- NOAA, “Be a Tree Ring Detective” — wood structure, growing conditions, and crossdating.
- NIST, “How Do You Measure the Age of a Tree?” — missing and extra rings, incomplete samples, and crossdating.
- Howard J. Falcon-Lang, “Global climate analysis of growth rings in woods, and its implications for deep-time paleoclimate studies,” Paleobiology 31 (2005) — modern calibration and limits on quantitative inference.
- Anne-Laure Decombeix et al., “A dwarf conifer tree from the Triassic of Antarctica: the first fossil evidence of suppressed growth in a favourable climate?” Annals of Botany (2025; online 2024).
- Marc Philippe, “Palaeoclimate and fossil woods—is the use of mean sensitivity sensible?” Acta Palaeontologica Polonica 68 (2023) — assessment of mean sensitivity and its interpretation.