As of 2026-07-28 08:35 UTC, two large HIV-financing numbers are circulating at the 26th International AIDS Conference in Rio de Janeiro. UNAIDS says external financing for the HIV response in low- and middle-income countries fell 18%, from $8.8 billion in 2024 to $7.3 billion in 2025. A KFF–UNAIDS tracker says donor-government funding fell 25%, from $8.3 billion to $6.2 billion.[1][2]
This is not a correction story. The trackers count different parts of the funding chain. The more important question is what both ledgers reveal: prevention, testing and community delivery can contract before aggregate infection and mortality data show the full result.
The following seven-question briefing separates money committed from money delivered, a warning of resurgence from a documented global reversal, and a stable treatment headline from the thinner system underneath it.
Fact Line
| Timestamp / source | Verified signal | Confidence boundary |
|---|---|---|
| UNAIDS, July 27 | International resources available for HIV in low- and middle-income countries fell by about $1.6 billion, or 18%, in 2025. Total domestic and international resources were $17.6 billion, $4.3 billion below estimated annual need.[1] | High for UNAIDS's July estimate. The full health effect will lag the financing year, and later country reporting may revise the estimate. |
| KFF–UNAIDS, July 27 | Donor-government funding fell $2.1 billion, or 25%, to $6.2 billion. The U.S. decline accounted for the aggregate fall; funding from other donor governments was flat.[2] | High within this tracker's donor-government scope. It is not the same denominator as all international resources available to programmes. |
| WHO, July 27 | About 32 million people were receiving HIV treatment at the end of 2025, while about 9 million were not. Since 2010, new infections had fallen 42% and AIDS-related deaths 57%.[3] | These are estimated global outcomes, not a real-time reading of every service disrupted during 2025. |
| amfAR-led PEPFAR Pulse study, July 21 | Among 166 responding PEPFAR partners in 46 countries, 77% reported a terminated award or delayed payment and 1,714 service sites were reported closed.[4] | The respondents represented 23% of country-level PEPFAR partners. This is substantial operational evidence, not a census of all PEPFAR sites or countries.[4][5] |
| PEPFAR, current dashboard | The U.S. programme reports 20.6 million people receiving standard HIV treatment and 103,000 pregnant or breastfeeding women newly enrolled on PrEP in its highlighted reporting period.[6] | A portfolio total can remain large while particular providers, populations or services lose coverage. Period definitions and site-coverage changes matter. |
1. Why do 18% and 25% describe the same year?
Because the money is being measured at two different points in the pipe.
The 25% KFF–UNAIDS measure starts with donor governments. It adds their bilateral disbursements to low- and middle-income countries and their contributions to multilateral institutions, principally the Global Fund and Unitaid. On that basis, donor-government support fell from $8.3 billion to $6.2 billion.[2]
The 18% UNAIDS measure asks how much international financing was available to HIV programmes. Its accounting uses multilateral organizations' actual disbursements during 2025 rather than treating donor contributions to those organizations as if the same money necessarily reached programmes in the same year. That broader programme-side total fell from $8.8 billion to $7.3 billion.[1][2]
Contributions into a multilateral fund and disbursements out of it can land in different calendar years. Other international flows also sit outside KFF's donor-government series. There is a currency-basis difference too: KFF presents preliminary current-dollar estimates, while UNAIDS presents its resource series in constant 2024 dollars.[1][2] The starting totals, ending totals and percentage changes therefore differ without either calculation being wrong.
The rule for reading the figures is simple: attach the denominator every time. “International resources available fell 18%” and “donor-government funding fell 25%” are defensible. “HIV funding fell by somewhere between 18% and 25%” is not; it blurs two ledgers into a fake range.
2. Has the global epidemic already rebounded?
Not in the latest global outcome totals. UNAIDS estimates 1.2 million new HIV infections and 570,000 AIDS-related deaths in 2025, both at their lowest levels in roughly three decades. About 32.1 million of 40.9 million people living with HIV were receiving treatment.[1] Those gains are real.
They are also incomplete and uneven. UNAIDS says new infections rose in three regions and 21 countries in 2025; roughly 22% of people living with HIV were not on treatment, and nearly half of children living with HIV lacked antiretroviral therapy.[1] WHO's parallel assessment likewise puts the untreated population at about 9 million and says several regions are moving in the wrong direction.[3]
“Risk of resurgence” is therefore a conditional forecast, not a claim that a global reversal has already been measured. Funding can stop in January, a prevention contract can close in February, a missed infection may not be diagnosed for months, and its effect on national incidence or mortality may emerge later still. UNAIDS explicitly says the full effects of the 2025 cuts will become evident over the next few years.[1]
That lag is the central uncertainty boundary. The 2025 outcome data partly reflect systems built and financed before the disruption. They cannot yet settle how much of the service loss will become new infection, treatment interruption or death.
3. Which services are showing stress first?
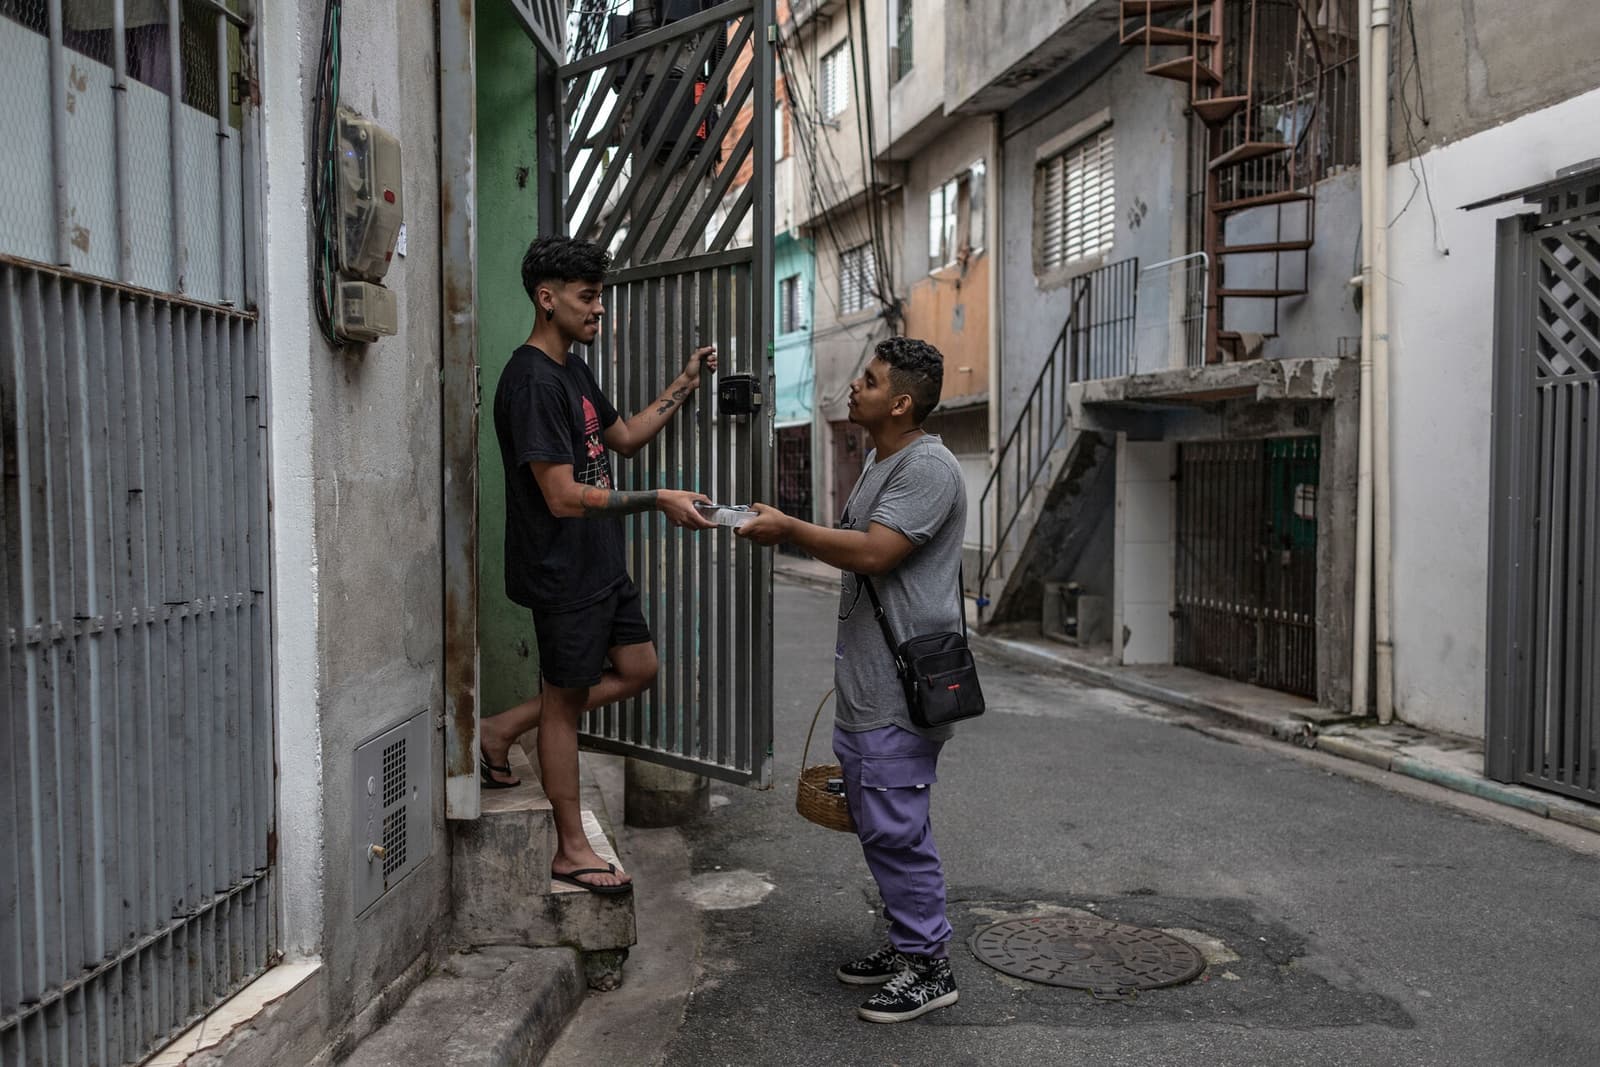
The early losses are concentrated in the connective tissue around treatment: prevention, testing, outreach, referral, adherence support and community-run services.
That ordering follows the funding structure. In 2024, external sources supplied 66% of HIV-prevention funding in low- and middle-income countries and 83% in sub-Saharan Africa. UNAIDS's initial country data show PrEP use falling by more than half in Cameroon, Nigeria and Zambia between 2024 and 2025; across 62 reporting countries, the number of people receiving PrEP at least once fell 38%.[1]
The PEPFAR Pulse study sees the same vulnerability from the provider side. Respondents reported a 51% fall in prevention spending, more than a quarter of implementing partners permanently stopping PrEP, and a 93% decline in condom and lubricant expenditure. Nearly three-quarters stopped at least one service designed for populations disproportionately affected by HIV.[4]
Those percentages should not be stacked as though they measure one population. The UNAIDS figures combine national programme reporting; the PEPFAR study is a survey of 166 implementing partners. Associated Press noted that organizations most severely disrupted—or still receiving funds—may have been less likely to respond, so the survey could overstate or understate the wider effect.[5]
The convergence is still meaningful. Different instruments are detecting damage at the same interface: the services that find people before illness, connect them to a clinic and help them remain in care.
4. Is treatment protected, then?
Protected is too strong. Maintained at large scale, with warning signs underneath, is closer to the evidence.
WHO says 32 million people were on treatment at the end of 2025.[3] The PEPFAR dashboard highlights 20.6 million people receiving standard treatment, and the U.S. government told AP that this was stable against the comparable prior period. It also pointed to 103,000 pregnant and breastfeeding women newly enrolled on PrEP, up from 43,000 in the comparison period.[5][6] Those are important counterweights to a simple collapse narrative.
But a treatment total is a stock, not a complete delivery audit. The PEPFAR Pulse respondents reported that 21.2% of organizations offering HIV care and treatment had stopped at least one such service. They also reported losses in testing, outreach and treatment support—the routes through which a person enters care, receives refills and returns after an interruption.[4]
Both descriptions can be true. A programme can keep millions of established patients on therapy while becoming worse at finding the next patient, retaining people with difficult access, or serving a criminalized population. The decisive treatment indicators are therefore not only “people currently on ART,” but also new diagnoses linked to care, refill continuity, loss to follow-up and viral suppression.
5. Can domestic financing replace the missing external money?
It has softened the aggregate fall, but it cannot be assumed to replace the same services in the same places.
Domestic sources supplied 59% of the $17.6 billion available for HIV responses in low- and middle-income countries in 2025, and increases in domestic spending limited the overall resource decline to 6% even as international resources fell 18%.[1] UNAIDS's 2026–2031 strategy is built around more country ownership, integration with primary care and universal health coverage, and stronger community leadership.[7]
The remaining mismatch is large: UNAIDS estimates $21.9 billion a year is needed through 2030, leaving a $4.3 billion gap against 2025 resources.[1][7] Fiscal capacity is also least flexible in some high-burden, low-income countries carrying heavy debt. A ministry may preserve antiretroviral procurement yet lack room to replace a donor-funded mobile clinic, civil-society contract or outreach team.
Integration can reduce duplication and make HIV services more durable. WHO points to countries combining HIV, hepatitis and STI services with tuberculosis, sexual and reproductive health, maternal care and primary care.[3] But integration is not a synonym for absorption. Moving a service into a general clinic can save overhead; it can also lose reach if the clinic is distant, stigmatizing or unsafe for the people the community provider served.
The financing test is not whether a national budget line grows. It is whether the same people can still obtain prevention, testing, treatment and support without longer journeys, new fees or loss of confidentiality.
6. What should change over the next 24 hours, 7 days and 30 days?
Next 24 hours: every donor, agency and newsroom should label its ledger. Reports should distinguish appropriation, donor contribution, bilateral disbursement, multilateral disbursement and total resources available. The 18%–25% gap is useful information about the funding chain; presenting it as a dispute wastes it.
Next 7 days: AIDS 2026 is under way in Rio.[1][3] Any funding or access announcement made at the conference should specify the amount, disbursement date, eligible countries, service category and first delivery milestone. A pledge without a cash date cannot be matched against a closed site or missed refill.
Next 30 days: national programmes and funders should publish a short operational reconciliation: active and closed sites, staff lost and rehired, HIV tests performed, people starting or continuing PrEP, antiretroviral stockout days, refill interruptions, linkage to care and viral-suppression coverage. Community providers should be reported separately rather than disappearing inside a national total.
For health ministries, the immediate action is triage: protect uninterrupted treatment and commodity supply while restoring the prevention and community routes that keep future treatment need from growing. For donors, it is to convert appropriated or pledged money into dated disbursements. For conference reporters, it is to keep global progress, regional reversal and local service closure as three distinct levels of claim.
7. What would confirm—or weaken—the warning?
Base case: large treatment programmes continue, but prevention and community coverage recover only partially. Global deaths do not jump immediately; missed testing, PrEP uptake and loss-to-follow-up indicators deteriorate first, with incidence effects emerging unevenly by country.
Upside case: delayed funds are disbursed, domestic bridge financing reaches community providers, closed sites reopen and comparable testing, PrEP and refill volumes return toward 2024 levels. Treatment retention and viral suppression remain stable while new infections continue to decline.
Downside case: prevention losses spread into antiretroviral stockouts and refill interruptions. Linkage to care, retention and viral suppression weaken, especially for children and key populations, and country-level infection increases broaden beyond the three regions already moving upward.[1][3]
The invalidation condition for the article's “connectors break first” reading is clear: comparable country dashboards would need to show prevention, testing and community delivery at or above their 2024 levels after reporting gaps close, with stable retention and viral suppression. Conversely, worsening stockouts, loss to follow-up or suppression would show that this briefing is too cautious.
Action Checklist
- Keep the 18% and 25% series separate and publish the denominator beside every update.
- Track service volumes—tests, PrEP starts and continuations, condom supply, referrals and refills—not only budget totals.
- Pair the global treatment count with retention, viral suppression and child-treatment coverage.
- Record which closed sites reopen, for whom, and with what staffing and funding duration.
- Treat a pledge as unresolved until there is a disbursement date and a receiving programme.
- Reassess the resurgence warning when comparable 2026 incidence and mortality data arrive; do not use 2025 outcome gains to declare the service disruption harmless.
The arithmetic is not the scandal. The 18% figure shows what reached the broader international financing pool; the 25% figure shows a sharper donor-government retreat upstream. Read together, they locate the real test of AIDS 2026: whether governments and donors can repair the route from budget to community before today's service cuts become tomorrow's epidemiology.
Sources
- UNAIDS, Special Report for the 26th International AIDS Conference: United to End AIDS (July 2026) — primary report for 2025 epidemic estimates, the 18% international-financing decline, prevention and community-service indicators, funding need, and the stated lag before full effects become visible.
- KFF and UNAIDS, “Donor Government Funding for HIV in Low- and Middle-Income Countries in 2025” (July 27, 2026) — methodology and results for the distinct donor-government series, including bilateral disbursements, multilateral contributions and the 25% decline.
- World Health Organization, “Integration, innovation and community leadership key to ending HIV, hepatitis and STIs” (July 27, 2026) — current treatment and outcome estimates, service-integration priorities, prevention warning, and source page for the Dan Agostini photograph.
- amfAR, “PEPFAR Pulse Study Finds More Than 1,700 HIV Service Sites Worldwide Shut Down Following Cuts to PEPFAR Funding” (July 21, 2026) — provider-survey scope, service-closure count, prevention expenditure, service interruptions and respondent denominator.
- Associated Press, “US actions harm global efforts to prevent and treat HIV in dozens of countries, new report says” (July 21, 2026) — independent account of the PEPFAR Pulse findings, survey limitations and the U.S. government's response.
- U.S. President's Emergency Plan for AIDS Relief, “Panorama Spotlight” (current dashboard) — official highlighted treatment and prevention programme totals and indicator definitions.
- UNAIDS, “Global AIDS Strategy 2026–2031” — official targets, annual resource requirement and framework for country ownership, integration and community leadership.