Priced: faster pay growth is an inflation problem and a margin problem. New: the second-quarter productivity release showed why that shortcut can fail. Hourly compensation in the nonfarm business sector rose at a 2.7% annual rate, but output per hour rose 1.4%. The resulting increase in unit labor costs was 1.3%—less than half the compensation rate.[1]
That compensation-productivity gap is the macro bridge from a wage headline to the cost of producing one unit of output. It does not prove inflation is beaten, or that corporate margins will expand. It says that compensation is only the numerator. Productivity changes the denominator.
As of August 10, 2026, the investor-relevant question is therefore not simply whether labor is getting more expensive. It is whether pay is rising faster than the amount of output an hour of labor can produce—and, after that, whether companies pass the residual cost into prices, absorb it in margins, or offset it somewhere else.
The subtraction the wage headline leaves out
The Bureau of Labor Statistics defines unit labor costs as labor compensation divided by real output. The same relationship can be read as hourly compensation divided by labor productivity.[2] In shorthand:
unit labor cost growth ≈ compensation-per-hour growth − output-per-hour growth.
Here compensation is broader than wages: it includes wages and salaries, employer contributions to benefit and social-insurance programs, and an estimate of compensation for self-employed workers.[1] “Wages” in the market shorthand therefore understates the numerator BLS actually uses.
The headline nonfarm business sector also excludes farms, general government, nonprofit institutions, and household production. It is neither the whole economy nor a panel of listed companies.[1][2]
The approximation matters because published growth rates are compounded, but the economic intuition is exact. If pay rises and output per hour does not, labor costs more for each unit made. If pay and productivity rise together, a company can pay more per hour without the same increase in labor cost per unit.
This is why the Federal Reserve has emphasized that the inflationary effect of wage gains depends importantly on productivity.[3] A wage series measures the price of labor. It does not measure how much saleable output that labor produces. Unit labor cost connects the two.
The clocks also differ. The second-quarter productivity figures above are quarter-over-quarter changes expressed at seasonally adjusted annual rates. They are not year-over-year wage growth, and they should not be placed beside a twelve-month inflation rate as though the periods were identical. The Employment Cost Index offers another view: it controls for shifts in the occupational and industry mix and separates wages, benefits, and total compensation. But it still measures labor price, not output per hour.[4]
That makes the two releases complements. ECI asks how the price of a comparable job is changing. Productivity and costs ask what that labor price means after accounting for output.
What the second quarter actually changed
Before the release, an investor could reasonably tell a simple story: a still-firm labor market keeps compensation elevated, elevated compensation keeps service inflation sticky, and labor-heavy companies lose margin unless they raise prices. The second-quarter data did not erase that risk. They weakened the assumption that compensation maps one-for-one into unit cost.
The key observation is the gap between the numerator and denominator. Compensation per hour advanced, but productivity absorbed part of the increase. The residual unit-cost rate was positive, not alarming on its own, and materially below the compensation headline.[1]
Manufacturing shows why neither the aggregate nor a single quarter should become a universal call. Manufacturing unit labor costs were unchanged at an annual rate in the quarter, yet stood 3.5% above a year earlier.[1] One clock says the immediate pulse cooled; the other says the accumulated cost level still carries pressure. Both are true.
Revisions are part of the signal, too. BLS revised the first-quarter productivity estimate higher and its unit-labor-cost estimate lower when fuller information arrived.[1] That is a warning against treating the preliminary second-quarter bridge as a settled fact. Productivity is calculated from output and hours data assembled on different schedules, so a modest change in either side can move the residual.
The useful interpretation is deliberately narrower: the latest evidence gives less support to the claim that current compensation growth must automatically become equivalent unit-cost growth. It does not yet establish a durable productivity regime.
Three exits from the same cost shock
Suppose compensation outruns productivity and unit labor cost rises. The accounting pressure can leave through three doors.
First, a company can raise prices. If volume holds, that can protect profit per unit; whether it protects gross or operating margin depends on where labor is classified. The macro consequence is more persistent inflation. Pricing power depends on contracts, competitive intensity, customer budgets, and the visibility of alternatives. An aggregate cost series cannot tell which issuer possesses it.
Second, the company can absorb the cost. Prices remain stable, but labor expense takes a larger share of revenue. This is the margin-negative path embedded in the bearish wage narrative. It is most dangerous where labor is a large cost, demand is elastic, and contracts reprice slowly.
Third, the company can alter the denominator. Better scheduling, equipment, software, training, process redesign, or greater utilization can increase real output per labor hour. BLS is careful not to attribute productivity to labor effort alone: capital, technology, scale, management, skills, and the organization of production all contribute.[2] A shift toward higher-value products may raise revenue per hour, but that is a price-and-mix channel—not proof of higher BLS productivity.
That third door is the reason productivity matters for both macro and equity analysis. It is also where poor analysis becomes most tempting. A company announcing automation is not the same as a company producing more real output per paid hour. The evidence has to appear in throughput, utilization, service volumes, cost per transaction, or another operating measure appropriate to the business.
The labor-share trap
The release contained a striking distributional statistic: labor's share of nonfarm business-sector output was 52.9%, the lowest reading in a series that begins in 1947.[1] It is easy to turn that into a bullish margin headline—if labor receives a smaller share, owners must be receiving the rest.
That conclusion outruns the accounts. The residual nonlabor payments include profits, consumption of fixed capital, taxes less subsidies, net interest and miscellaneous payments, business transfers, rental income, and the surplus of government enterprises.[1] A lower labor share can coexist with heavier financing costs, capital consumption, or other nonlabor claims. It is not a clean proxy for listed-company operating margin, and it says nothing by itself about which industries captured the difference.
For investors, labor share is context, not a trade. The company-level bridge still runs through revenue mix, labor intensity, depreciation, interest expense, and tax. A software platform, a hospital, an airline, and a manufacturer can face the same macro unit-cost print with completely different earnings consequences.
The strongest counterweight
The best objection is that aggregate productivity is too noisy and too far removed from an individual income statement to carry much weight. Quarterly estimates are revised; sector composition changes; measured output is difficult in services; and a national denominator can improve while a particular company becomes less efficient. Even the nonfarm business and manufacturing series can move differently.[1][2]
That objection is right about the boundary. Unit labor cost is a screen, not a stock picker. It can disprove the lazy equation “wages up equals margins down by the same amount,” but it cannot substitute for company disclosures. The appropriate next step is to compare the macro bridge with management's volume, headcount, compensation, utilization, price, and unit-cost commentary.
The series is still useful because it forces the causal question into the open. A wage print alone invites a directional story. Unit labor cost asks whether productivity offset it. Company evidence then asks who generated the offset and who merely benefited from mix.
Falsifier
The investable thesis is that the second-quarter productivity offset can persist long enough to keep aggregate labor-cost pressure from intensifying and give profits room. It is falsified if the September 3 revision removes much of that offset, the same release's nonfinancial-corporate table shows unit labor costs accelerating while unit profits contract, and the November 5 preliminary third-quarter release again shows compensation outrunning productivity across both nonfarm business and manufacturing. In that combination, the preliminary second-quarter bridge was quarterly noise rather than a durable offset.[1][5][6]
Watchlist
- August 26 — second-quarter corporate profits: BEA will add the profit information that the advance GDP release omits. Treat the dollar change as a leading check, not a direct match for BLS unit labor cost; compare nonfinancial-corporate profits with nonfinancial-corporate gross value added before reading the margin direction.[6]
- September 3 — revised second-quarter productivity and costs: watch whether the compensation-productivity gap survives fuller output and hours data. Then use BLS's nonfinancial-corporate table for the same-scope comparison between unit labor cost and unit profit.[1][5]
- October 30 and November 5 — ECI, then preliminary third-quarter productivity: use the first release to read the labor-price pulse and the second to learn how much output per hour offset it. A renewed compensation pulse is not equivalent to unit-cost acceleration until the denominator arrives.[4][5]
The clean takeaway is not that wages have stopped mattering. It is that a wage is a price, while a margin is the result of prices, volumes, and costs interacting. Productivity is the bridge between labor's hourly price and labor's cost per unit. Ignore it, and both the inflation call and the margin call begin one step too early.
Sources
- U.S. Bureau of Labor Statistics, “Productivity and Costs — Second Quarter 2026, Preliminary” — compensation, productivity, unit labor costs, revisions, manufacturing, and labor share.
- U.S. Bureau of Labor Statistics, Handbook of Methods, “Productivity Measures: Concepts” — definitions, accounting relationships, and contributors to productivity.
- Board of Governors of the Federal Reserve System, July 2024 Monetary Policy Report, Part 1 — the relationship among wages, productivity, firm costs, and inflation.
- U.S. Bureau of Labor Statistics, “Employment Cost Index — June 2026” — composition-adjusted compensation measures and the next-release date.
- U.S. Bureau of Labor Statistics, Productivity and Costs release calendar — revised second-quarter and preliminary third-quarter publication dates.
- U.S. Bureau of Economic Analysis, “Corporate Profits” — release timing and the relationship between GDP estimates and the profits data.
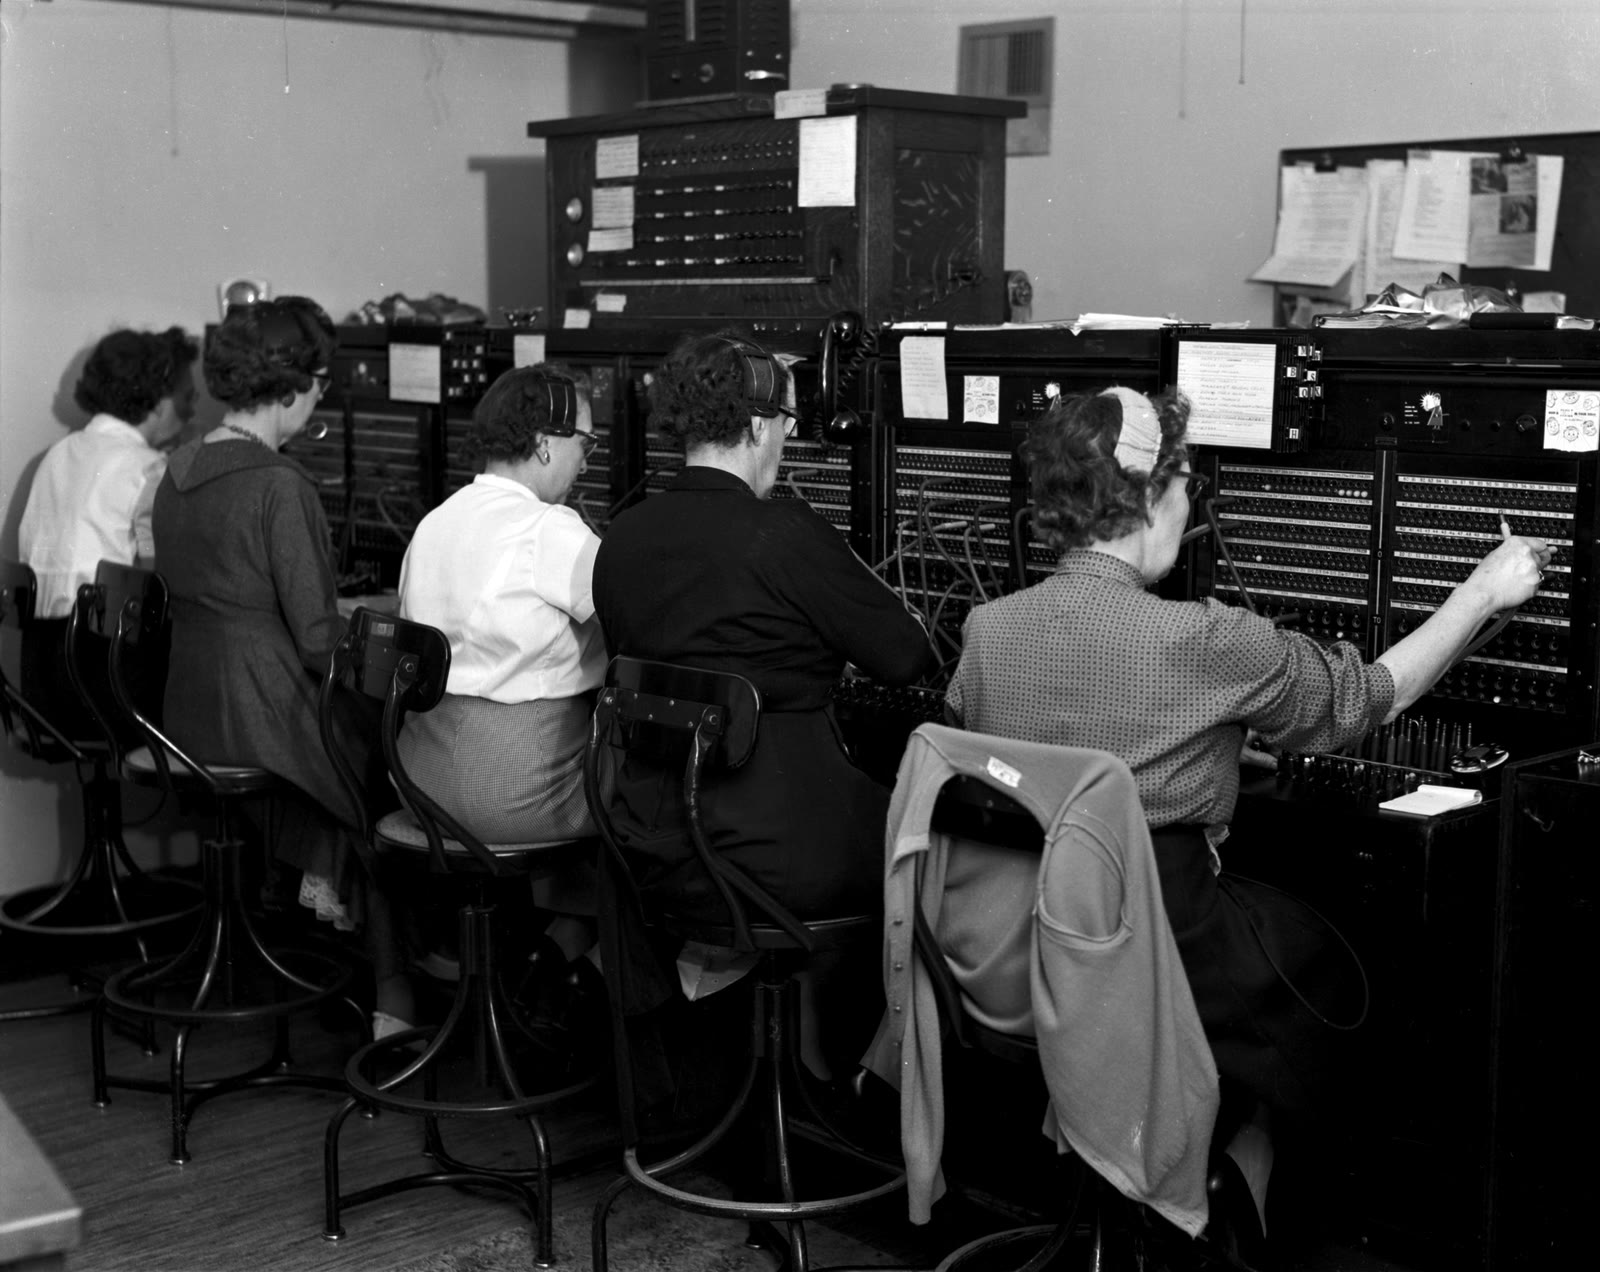
- Seattle Municipal Archives via Wikimedia Commons, “Switchboard operators, 1958” — archival photograph and provenance.