Priced: Bloom Energy entered its July 28 report with a roughly $53.5 billion market value, after investors had already rewarded the company for becoming an on-site power supplier to AI data centers.[6] New: Q2 revenue crossed $1 billion for the first time, while gross margin, operating cash flow, and the related-party mix all improved at once.[1] The quarter proved that Bloom can operate near the run rate embedded in its raised 2026 guidance. It did not yet prove that the run rate rests on a broad customer base or a large recurring-service engine.
That is a better problem than Bloom had a year ago. The company is no longer asking investors to bridge from announcements to an imagined income statement. It reported $1.065 billion of revenue, 33.4% GAAP gross margin, $182.2 million of GAAP operating income, and $226.4 million of operating cash flow. The next analytical step is to identify what kind of revenue produced those results—and how repeatable it is.[1]
Evidence cut-off: August 9, 2026. Market value is the July 27 pre-earnings figure reported by Stock Analysis, not a live quote. Non-GAAP measures below use Bloom's definitions and are reconciled in its release. This is an earnings readout, not a recommendation to buy or sell the shares.[1][6]
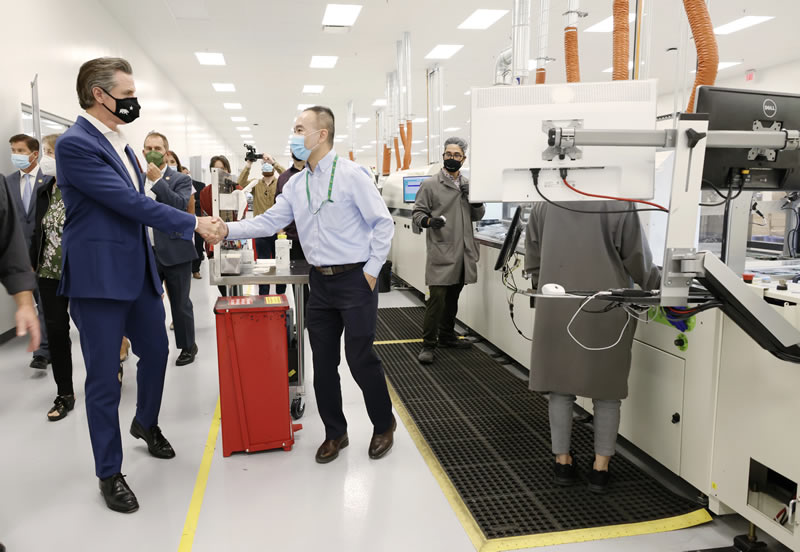
Image context: the cover is an official photograph from the July 2022 opening of Bloom's Fremont, California, manufacturing plant. It documents the production setting, not Q2 2026 activity. That distinction matters because this quarter's cleanest evidence is factory economics—product volume, product margin, and cash—not an image of an AI data center or a stock chart.[7]
The quarter moved the story from promise to throughput
Revenue increased 165.5% year over year to $1.065 billion. Product revenue did more than carry the growth: it rose 215.4% to $935.4 million and represented almost 88% of total revenue. Product gross margin reached 36.5% on a GAAP basis, up from 33.0% a year earlier. This was not merely a larger shipment quarter; each reported product dollar also carried more gross profit.[1]
The operating leverage was substantial. Total GAAP gross margin expanded by 6.7 percentage points to 33.4%, while operating margin moved from negative 0.9% to positive 17.1%. Operating expenses rose by $62.7 million year over year, but gross profit rose by $248.4 million. The factory and fixed-cost base therefore absorbed the revenue step without consuming it.[1]
Cash confirmed that the accounting profit was not stranded entirely in working capital. Q2 operating cash flow was $226.4 million, compared with a $213.1 million outflow a year earlier. Together with Q1's $73.6 million inflow, Bloom generated roughly $300 million of operating cash in the first half.[1][2]
This is the strongest part of the print. Large AI-power agreements had already made demand sound enormous: Oracle said an initial 1.2 GW was contracted under an agreement that could support up to 2.8 GW, and Brookfield expanded its project-financing framework with Bloom from $5 billion to $25 billion.[4][5] Q2 supplied the missing bridge from announced capacity to a quarter with product revenue, margin, and cash.
The run-rate math is less heroic than the growth rate
Bloom raised full-year revenue guidance to $3.9 billion–$4.2 billion. At the $4.05 billion midpoint, the company needs about $2.23 billion in the second half, or roughly $1.12 billion per quarter. That is only about 5% above Q2 revenue.[1]
The profit requirement is even closer to the latest quarter. First-half non-GAAP operating income totaled about $369 million. To reach the new $850 million midpoint, Bloom needs approximately $481 million in the second half—about $240 million per quarter, essentially equal to Q2's $239.6 million.[1][2]
That arithmetic changes the interpretation of the guidance raise. In February, Bloom guided to $3.1 billion–$3.3 billion of 2026 revenue and $425 million–$475 million of non-GAAP operating income. After two quarters, its new full-year midpoint is 26.6% higher for revenue and almost 89% higher for operating income.[3] Yet the second-half hurdle does not require another doubling. It mainly requires Bloom to hold the Q2 machine steady.
The priced-versus-new gap is therefore narrow but important. Before the result, the equity value already assumed that AI power demand would be large. Q2 added evidence that Bloom can ship at scale and preserve margin. The remaining upside case depends less on another spectacular year-over-year comparison and more on sustaining this quarterly level without customer timing, working capital, or installation economics breaking the cadence.
Related-party revenue fell; concentration did not disappear
The most encouraging quality signal sits in a footnote. Bloom reported only $2.8 million of related-party revenue in Q2, down from $373.3 million in Q1. In other words, the $314 million sequential revenue increase occurred while reported related-party revenue fell by more than $370 million.[1][2]
That makes Q2 a cleaner external-demand proof than Q1. But “not related party” does not mean “diversified.” Bloom's Q1 Form 10-Q said its two largest customers accounted for approximately 50% and 12% of revenue; it also warned that the contractual customer may be a project-finance affiliate rather than the ultimate user.[2] The Q2 earnings release provides the related-party figure but not an updated customer-concentration table. The forthcoming 10-Q must do that work.
The revenue mix creates a second boundary. Service revenue was $69.0 million, just 6.5% of the quarter, though its GAAP gross margin improved to 18.7%. Installation revenue was $51.0 million and still carried a negative 3.6% gross margin. Product shipments made Q2 excellent; the recurring and deployment layers remain much smaller and, in installation's case, unprofitable.[1]
This does not negate the quarter. A manufacturer should earn money selling its product. It does mean that investors should not read a $20 billion backlog, a $25 billion financing framework, and a multi-gigawatt master agreement as three interchangeable forms of recurring revenue. Backlog is a company-defined future revenue pool, a financing framework supplies eligible projects with capital, and a customer agreement sets a procurement path. Only shipped and accepted systems reach the current income statement.[3][4][5]
The strongest counterweight is visible in the balance sheet
Bloom has the cash to fund growth: cash and equivalents were $2.67 billion at June 30. The build also tied up more operating assets. Current contract assets rose from $178.9 million at year-end to $365.5 million, and inventory increased from $643.3 million to $758.2 million. Deferred revenue and customer deposits rose as well, providing an offsetting sign that customers are funding part of the pipeline.[1]
The point is not that working capital looks alarming after one record quarter. It is that a shipment-led model can produce lumpy cash as systems move through manufacturing, contracting, installation, acceptance, and collection. Q2's positive cash flow is a strong result precisely because those balances were rising. Repeating it would be stronger evidence than annualizing it.
There is also an equity denominator. Basic shares outstanding increased from 280.0 million at year-end to 293.4 million at June 30, while Q2 diluted weighted-average shares were 323.3 million. Bloom also issued Oracle a warrant for up to roughly 3.5 million shares in connection with the relationship.[1][4] High growth can absorb dilution economically, but per-share value depends on growth outrunning the expanding claim count.
What would break this read
The thesis that Q2 established a sustainable operating run rate would be falsified if Q3 revenue falls below $900 million and GAAP gross margin drops below 30% without a clearly disclosed shipment-timing shift. That combination would show that Q2 was a concentration event rather than a new quarterly base.
The customer-mix caution has its own clean answer: an updated filing showing no dominant customer, alongside another quarter near the Q2 revenue and cash levels, would turn diversification from an assumption into evidence.
Watchlist
- Q2 Form 10-Q, expected by August 10: look for the top-customer revenue shares, the identity and economics of related-party transactions, contract-asset aging, customer consideration, and any change in backlog definitions.
- September 30 quarter-end: test whether current contract assets and inventory grow more slowly than revenue, and whether operating cash remains positive while Bloom sustains roughly a $1.1 billion quarterly pace.
- Q3 2026 results: compare product gross margin with Q2's 36.5%, installation margin with negative 3.6%, and service revenue with $69.0 million. A broader profit mix matters more now than another headline growth percentage.[1]
- December 31, 2026: hold the final result against the $4.05 billion revenue and $850 million non-GAAP operating-income midpoints, then separate recognized revenue from capacity still covered only by backlog, master agreements, or financing frameworks.[1][4][5]
Bloom's second quarter deserves a high-quality verdict: the growth story acquired operating evidence. The company crossed $1 billion of quarterly revenue, expanded product margin, generated cash, and did so with little reported related-party revenue. What Q2 did not settle is just as specific. The next rerating must be earned through customer breadth, repeatable cash conversion, and a larger profitable service-and-installation layer—not simply another large number attached to AI power demand.
Sources
- Bloom Energy, “Bloom Energy Reports Record Second Quarter 2026 Financial Results and Raises Full Year 2026 Guidance,” July 28, 2026 — revenue mix, margins, cash flow, guidance, related-party revenue, balance sheet, and share counts.
- Bloom Energy, Quarterly Report on Form 10-Q for the quarter ended March 31, 2026 — Q1 cash flow, related-party revenue, customer-concentration disclosure, and project-finance customer definition.
- Bloom Energy, “Bloom Energy Reports Fourth Quarter and Full Year 2025 Financial Results with Record Full Year Revenues,” February 5, 2026 — initial 2026 guidance and year-end product and service backlog.
- Bloom Energy, “Bloom Energy and Oracle Expand Strategic Partnership to Deploy up to 2.8 GW,” April 13, 2026 — contracted capacity, master-agreement ceiling, deployment timing, and Oracle warrant context.
- Bloom Energy and Brookfield, “Brookfield and Bloom Energy Expand AI Infrastructure Partnership to $25 Billion,” June 30, 2026 — financing-framework scale, structure, and stated project scope.
- Stock Analysis, “Bloom Energy Market Cap & Net Worth” — July 27, 2026 pre-earnings market capitalization and closing share price, sourced by the page from Nasdaq Data Link.
- Bloom Energy, “Bloom Energy Celebrates Grand Opening of Fremont Multi-Gigawatt Factory,” July 20, 2022 — official factory-opening photographs and facility context.