Fossil pollen is easy to underestimate because it looks too small to carry landscape-scale meaning. A dinosaur bone gives the eye a body. A fossil leaf gives the eye a plant. A pollen grain gives the eye a speck. The method becomes interesting at exactly that scale: palynology turns specks into evidence by asking what survived, how it moved, where it settled, and how many comparable grains appear beside it.
The strongest way to read fossil pollen is not as a miniature forest trapped in rock. It is a transport record with anatomy. Each grain came from a plant, moved through air, water, or local disturbance, entered sediment, survived chemical and microbial filtering, and then had to be recovered, identified, and counted. That chain is why fossil pollen can reconstruct vegetation and climate, but also why it must be interpreted more carefully than a simple species list.[2][3][4]
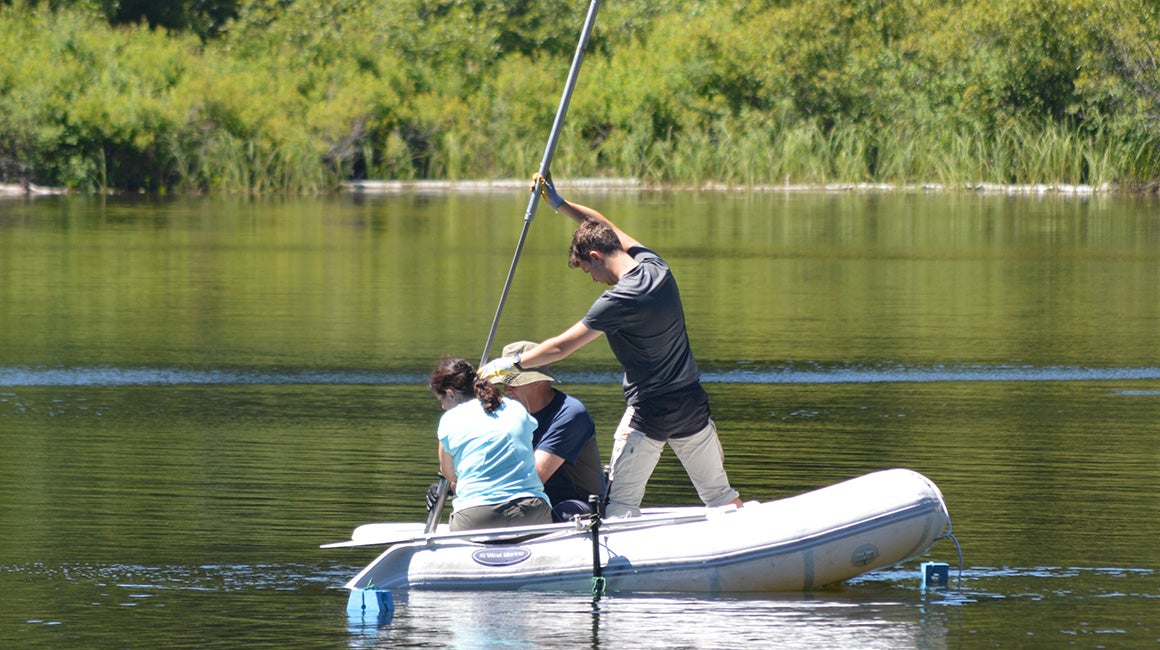
Image context: the lead image shows researchers collecting a lake sediment core, the field step that makes many pollen records possible.[1] It replaces the earlier microscope-composite cover because this QA sweep rejects diagram-like analytical visuals for active posts. The image keeps the article grounded in the physical chain: water body, sediment, core, laboratory slide, counted assemblage, and only then climate interpretation.
The first anatomical fact is the wall
Pollen and spores can become paleontological evidence because their outer walls are tough. The Palynological Society summarizes the key material reason: pollen grains are built with sporopollenin, a highly resistant macromolecule, and can be preserved in sediments and rocks.[3] USGS gives the broader fossil-time frame: land-plant spores are known from the Upper Ordovician, pollen from seed plants dates to the Late Devonian, and the first definitive flowering-plant pollen appears in Cretaceous rocks.[2]
That material durability is not a trivial preservation note. It explains why pollen can record plants that leave few visible leaves, trunks, flowers, or fruits. Florissant Fossil Beds National Monument makes this point in a local example: Eocene rocks there have yielded more than 150 pollen and spore types, and some plants are known only through pollen rather than larger fossils.[5] In a lake or basin, wind can carry grains from hillsides, ridges, or distant vegetation zones that rarely send leaves into the depositional center.[5]
The anatomy that matters is therefore not "tiny plant dust" in general. It is wall form: apertures, sculpture, size, outline, and surface pattern. Different plant groups produce recognizable pollen types, and palynologists use those morphological characters to sort grains into useful taxonomic categories.[3] The precision varies. Some grains can point closely toward a plant group; others only support a broader family-level or ecological reading. But the method begins with the same premise each time: the wall is durable enough to survive and patterned enough to compare.
The second fact is that abundance is a signal, but not a vote
Pollen often appears in large numbers. The Palynological Society notes that a gram of sediment can contain hundreds to millions of grains.[3] That abundance gives palynology its statistical power: one grain may be a traveler, contamination, or an odd survivor; an assemblage gives a pattern. NOAA's paleoclimatology program describes the basic inference clearly: pollen accumulating in sediment records vegetation that grew on or near the shore, and researchers infer climate by asking what conditions suited the pollen types recovered from different layers.[4]
Still, abundance is not a democratic vote by ancient trees. Some plants produce far more pollen than others. Some pollen travels farther. Some basins capture regional rain; others are more local. Some sediments preserve organic walls well; others oxidize, dilute, or destroy them. This means a pollen count is strongest when treated as a biased signal that can be modeled and checked, not as a direct census of every plant standing around the site.
That distinction changes the tone of the evidence. A high pine signal, for example, might reflect nearby conifers, long-distance wind transport, or both, depending on basin size, wind regime, and accompanying taxa. A swamp-forest signal becomes stronger when it appears with wetland plants, sedimentology, and independent geochemical evidence. A sudden shift in pollen percentages can reflect vegetation change, but it can also reflect transport, preservation, or source-area changes. The work is not simply naming grains; it is keeping the route from plant to slide in view.
The laboratory method keeps the rock from pretending to be neutral
The most useful palynology methods are explicit about extraction. Florissant's National Park Service description gives the public version: shale is dissolved in acids, leaving pollen residue that can be stained and mounted on a microscope slide.[5] In research workflows, that same basic idea becomes a controlled sequence with sample mass, chemical treatment, sieving, marker grains, and counting rules.
The Arctic IODP Site 302-4A study by Willard and colleagues is a good example because it exposes the method rather than hiding it behind a finished climate claim. The team sampled Paleocene and Early Eocene sediments, dried and weighed samples, added tablets with known numbers of Lycopodium spores, treated material with hydrochloric and hydrofluoric acids to remove carbonates and silicates, sieved residues with a 15 micrometer mesh, and mounted material on slides. Counts aimed for at least 300 grains when preservation allowed, or a lower minimum in sparse samples.[6]
Those details matter because they show why a pollen assemblage is partly natural archive and partly laboratory product. Acid removes matrix so organic-walled microfossils can be seen. Sieving imposes a size threshold. Marker spores let researchers estimate concentrations rather than only percentages. Count targets shape confidence. Sparse samples carry weaker numerical force than rich ones. The method is powerful because it is controlled, not because the sediment hands over a finished ecosystem.
This also explains why preservation language should be read seriously. A well-preserved grain can carry diagnostic wall pattern. A corroded or crumpled grain may remain countable only at a coarser level. A barren interval may mean plants were absent, but it may also mean the sedimentary environment failed to preserve the grains, or later alteration destroyed them. In fossil pollen work, "nothing there" is never automatically the same as "nothing lived there."
The best reconstructions cross-check scales
Fossil pollen becomes strongest when its scale is matched to the question. At Florissant, pollen helps recover high-slope or more distant plants whose larger remains were less likely to enter lake sediments, sharpening the picture of Eocene plant communities beyond the obvious leaf and insect fossils.[5] In paleoclimate archives, NOAA's pollen datasets organize study metadata and records so researchers can compare cores, locations, and time slices rather than relying on one isolated slide.[4]
The Arctic example shows why that matters. USGS explains that IODP Site 302-4A preserved pollen from nearby landmasses in late Paleocene and early Eocene Arctic Ocean sediments, letting researchers reconstruct vegetation and climate during warm intervals when today's Arctic geography and ecosystems were very different.[2] Willard and colleagues then combined pollen, spores, dinocysts, palynofacies, biomarkers, and stratigraphic context to discuss vegetation, hydrology, and warming events rather than asking pollen to carry the whole climate story alone.[6]
That is the right hierarchy. Pollen can say a great deal about plant communities and the climatic envelopes those plants imply. It is weaker when asked to stand alone as a thermometer, a rainfall gauge, or a precise map of every tree line. The strongest papers use pollen as one proxy among others: sedimentology for setting, isotopes or biomarkers for independent climate constraints, macrofossils where available, and age models to keep changes in sequence.
The practical reading rule is simple: trust fossil pollen most when the article tells you what was counted, where the grains could have come from, how preservation was judged, and what independent evidence agrees or disagrees. Be more cautious when a claim jumps from one named pollen type to a full landscape painting without discussing transport or depositional setting.
The speck is evidence because the chain is visible
Fossil pollen is a good antidote to spectacular-paleontology habits. It has no skull, claws, or reconstructed roar. Its drama is procedural. A grain survives because its wall chemistry is stubborn. It becomes meaningful because its morphology can be identified. It gains force because it appears in counted assemblages. It becomes climate evidence only after sediment context, source area, preservation, and comparison have been kept in the same frame.[2][3][4][6]
That does not make the method timid. It makes it exact. Pollen can reveal plants that larger fossils miss, connect cores across regions, show vegetation turnover, and anchor climate interpretations in the biology of actual plant groups. The cost is that every pollen record is also a record of movement and filtering. The grain on the slide is not the ancient forest in miniature. It is the final survivor of a journey from flower or cone to sediment to laboratory.
Read that way, fossil pollen becomes more impressive, not less. Its value comes from the fact that a microscopic object can keep enough anatomical identity to survive deep time, yet remain honest about the route that carried it there. The tiny grain does not let us skip the hard parts of paleontology. It forces us to do them carefully.
Sources
- UCAR Center for Science Education, "Pollen: More Than Just an Allergen," public explanation of pollen preservation in lake sediments, sediment cores, and paleoclimate interpretation; source page for the lake-core fieldwork cover image.
- U.S. Geological Survey, "Paleoclimate Proxies," terrestrial biological proxy discussion for pollen, spores, macrofossils, and climate reconstruction.
- The Palynological Society, "Pollen," overview of pollen morphology, sporopollenin, abundance, and geoscience uses.
- NOAA National Centers for Environmental Information, "Pollen," paleoclimatology data and interpretation overview.
- National Park Service, Florissant Fossil Beds National Monument, "Microscopic timecapsules," fossil pollen and the 34-million-year-old Florissant climate record.
- Debra A. Willard and colleagues, "Arctic vegetation, temperature, and hydrology during Early Eocene transient global warming events," Global and Planetary Change 178 (2019).