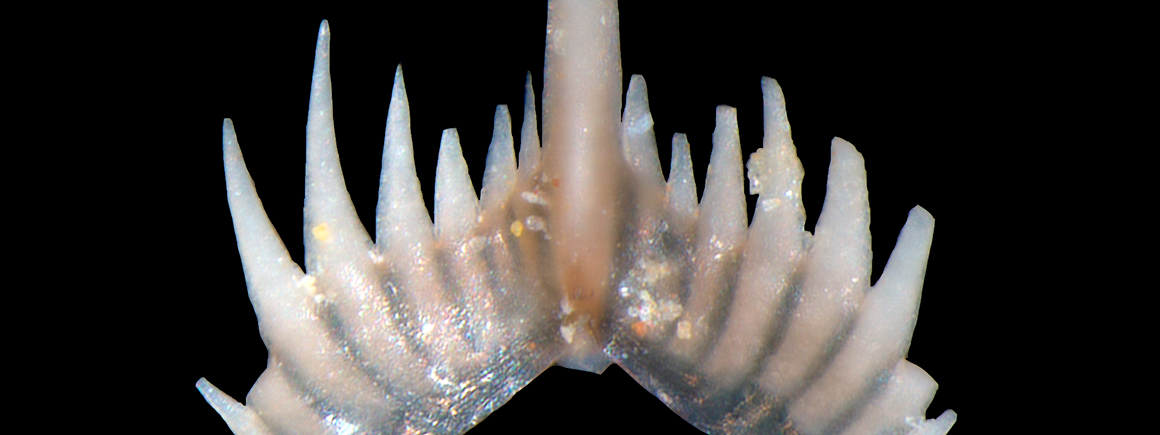
Under a microscope, a conodont element can look like a miniature saw made from amber. Give that same kind of fossil enough heat and time, however, and the amber darkens through brown to black. Heat it further and the sequence reverses in a stranger register: black gives way to gray, opaque white, and finally near transparency. The animal did not grow those later colors. The rock imposed them after burial.[2][3]
That is the premise of the conodont color alteration index, or CAI. A feeding element from an extinct jawless vertebrate becomes a semiquantitative record of the thermal history experienced by its host rock. Yet “fossil thermometer” is only a useful shorthand if its limitation stays attached. CAI does not return one exact peak temperature. It records a cumulative, effectively irreversible response shaped by heat, duration, burial environment, fluids, and the fossil's own construction.[2][4][5]
Image context: the cover is a real color photograph of an Ozarkodina confluens specimen in the Natural History Museum's conodont collection. The branching cusps make clear that the object being scored is biological tissue, not a mineral color chip. The photograph is not itself a CAI determination: magnification, illumination, element thickness, and comparison standards all matter.[1][2]
One element carries two histories
Conodont elements are the durable parts of a once-integrated feeding apparatus. Their shape records a biological history: growth, position in the apparatus, contact with food, and evolutionary change. Their color can record a second history that began after death. The elements are built largely from bioapatite, with carbonaceous material held between mineral crystallites and lamellae. As heating reorganizes that material, the visible element changes with it.[2][4]
At lower grades, carbonization darkens pale yellow or light amber elements toward brown and black. At higher grades, continued alteration removes or restructures the carbonaceous material while the apatite recrystallizes, sending the fossil through gray and white toward clear. The full CAI scale therefore runs from 1 for the least altered material to 8 for the most intensely altered and recrystallized material. It is not a simple march from light to dark. Black sits in the middle of the deeper thermal story.[2][3][4]
This is why anatomy cannot be ignored when color is read. The 1977 calibration study found that thick, robust, or mature elements could look darker than thin, delicate, or juvenile ones even within an otherwise unaltered assemblage, because their laminated tissues held different amounts of organic matter. A careful analyst does not place one dramatic specimen beside a web image and declare a temperature. Comparable morphologies, thin margins, several elements, surface texture, and within-sample variation all belong in the observation.[2]
The scale was built by cooking fossils
Anita G. Epstein, Jack B. Epstein, and Leonard D. Harris made the method systematic by starting with pale conodonts from the Upper Ordovician Kope Formation in Kentucky and heating them under controlled combinations of time and temperature. Laboratory heating reproduced the pale-yellow-to-brown-to-black sequence seen in field collections. The change was progressive, cumulative, and irreversible under the tested conditions.[2]
Their timing results explain why a CAI number cannot be translated through a single thermometer dial. Detectable alteration began after roughly 350 hours at 300°C, after about 5 hours at 400°C, and after only half an hour at 500°C. A hotter, shorter treatment and a cooler, longer history can move an element toward comparable visible states. Geological calibration therefore uses overlapping time-temperature envelopes, not one temperature per color.[2]
The practical method was deliberately modest. Recover conodonts from suitable rock, concentrate and pick the tiny elements, view them under controlled reflected light, and compare them with laboratory-produced or field-derived standards. Half steps can be assigned where the match is defensible. The low equipment cost made CAI especially useful in Paleozoic and Triassic marine carbonates, where vitrinite—the organic particle commonly used for reflectance measurements—may be sparse or absent while conodont elements remain recoverable.[2]
Simple equipment does not mean simple inference. The number at the microscope is an observation. Turning it into a burial-temperature history requires geology.
A map is stronger than a lone color
The original Appalachian work showed why. CAI values generally rose from pale yellow in the west to black toward the more deeply buried and heated east, and the broad pattern tracked overburden and geothermal history. Where folding and thrusting displaced rock packages, the color contours could be offset or repeated. In that setting, conodonts were doing more than screening hydrocarbon maturity: their regional pattern helped reconstruct burial and structure.[2]
A later review of Carboniferous conodonts in Scotland found most values clustered between CAI 1 and 1.5. The low regional background made the exceptions informative: only a small number of samples showed the local influence of igneous intrusions. The point was not that every light element proved one cool maximum. It was that many observations, placed back onto the geological map, separated a broad burial signal from local heating.[6]
This spatial logic also guards against reworking. A conodont eroded from older rock and deposited in younger sediment can carry an inherited thermal overprint. One dark element in a pale population may therefore be a traveler, a chemically altered specimen, or a local anomaly rather than evidence that the entire bed shared its history. Assemblage consistency, element texture, stratigraphic position, and neighboring samples decide whether the color belongs to the rock now surrounding it.[2][3]
Water and chemistry can bend the scale
Temperature is the main actor, but it does not perform alone. The foundational experiments found that confined pressure without water did not materially change carbonization under one set of conditions, while water combined with confined pressure retarded it. The later high-grade experiments extended CAI through regional, contact, and hydrothermal alteration and found that hydrothermal samples could contain disparate low and high values. At CAI 6 to 8, such fossils can flag an altered zone or potential mineralization, but they cannot safely provide a precise hydrothermal temperature by color alone.[2][3]
Diagenesis adds another complication. Recrystallization, mineral overgrowth, host-rock chemistry, and fluid movement can modify the fossil as well as heat it. McMillan and Golding's later work found that unusually iron-rich conodonts were among those whose visible CAI disagreed most strongly with independent temperature estimates; iron adsorption or oxide permineralization could darken the record without representing the assumed thermal path.[5]
These are not reasons to discard CAI. They are reasons to treat an index as an index. A coherent field of similar values in comparable material can be persuasive. A mottled sample beside an intrusion or fault is a prompt to investigate the fluids, textures, and structure rather than average the colors into false precision.
Raman spectroscopy gives color a cross-examination
The most useful modern improvement is independent measurement. Raman spectroscopy can assess how carbonaceous material has been structurally reorganized by heating. Applied to both conodonts and their host rocks, it supplies a check that does not begin by asking a human observer to choose the nearest color standard.[4]
In a 2019 study of Mississippian to Upper Triassic material from British Columbia, Raman-derived temperature estimates broadly correlated with CAI, but some specimens fell outside the temperature ranges their visible index would predict. The mismatch exposed exactly what a visual scale can blur: qualitative scoring, complex heating paths, and diagenetic color changes unrelated to temperature. The authors recommended combining Raman analysis of the fossil and host rock with CAI rather than letting color stand alone.[4]
That combination preserves what is elegant about the older method. CAI is fast, inexpensive, geographically mappable, and available in carbonate successions that may frustrate other maturity tools. Raman analysis is more instrument-intensive but can test the molecular transformation beneath the appearance. One finds the pattern; the other interrogates its cause.
The conodont in the cover photograph thus holds two kinds of deep time at once. Its cusps retain the shape of a vanished feeding apparatus. Its material can also retain what happened after the animal disappeared: burial, heating, fluid movement, recrystallization, and exposure. Color does not reveal that history in one glance. It gives the first disciplined question: what combination of time, heat, and chemistry made this fossil look this way?
Sources
- Natural History Museum, London, “Conodont collection” — collection context and source page for the real Ozarkodina confluens cover photograph.
- Anita G. Epstein, Jack B. Epstein, and Leonard D. Harris, Conodont Color Alteration—An Index to Organic Metamorphism, U.S. Geological Survey Professional Paper 995 (1977) — foundational experiments, visual standards, preparation method, time-temperature dependence, and Appalachian application.
- V. A. Rejebian, A. G. Harris, and J. S. Huebner, “Conodont color and textural alteration: An index to regional metamorphism, contact metamorphism, and hydrothermal alteration,” Geological Society of America Bulletin 99 (1987) — extension of CAI through high-grade and hydrothermal conditions.
- Rhy McMillan and Martyn Golding, “Thermal maturity of carbonaceous material in conodonts and the Color Alteration Index: Independently identifying maximum temperature with Raman spectroscopy,” Palaeogeography, Palaeoclimatology, Palaeoecology 534 (2019) — independent Raman test and limits of visual CAI.
- Martyn L. Golding and Rhy McMillan, “The impacts of diagenesis on the geochemical characteristics and Color Alteration Index of conodonts,” Palaeobiodiversity and Palaeoenvironments 101 (2021) — iron enrichment and other non-thermal controls on apparent color.
- Mark T. Dean and Nicholas Turner, “Conodont Colour Alteration Index (CAI) values for the Carboniferous of Scotland,” Transactions of the Royal Society of Edinburgh: Earth Sciences 85 (1994) — regional low-CAI pattern and local igneous effects.