Imagine changing a pumping schedule and asking what happens to the chlorine concentration at a distant tap. Before software can follow the chlorine, it needs to know where the water goes. EPANET, the open-source water-distribution simulator developed by the U.S. Environmental Protection Agency, makes that dependency visible: hydraulic calculations establish flows and pressures; water-quality calculations use the resulting history to follow what the water carries.[1][2]
That separation is the useful architectural idea inside a program whose subject mostly lies beneath the street. This reading follows EPANET 2.2, its user manual, and its version-pinned programmer's interface. EPA lists the official 2.2 release under July 23, 2020; the discussion concerns that documented model, rather than a claim about every later development branch.[1][3]
A tank remembers what happened
EPANET describes a network through nodes and links. Junctions, tanks, and reservoirs are nodes; pipes, pumps, and valves connect them. The distinctions encode different behavior. A tank stores water, so its level changes as inflow and outflow accumulate. A reservoir supplies an external hydraulic boundary: its prescribed head is unaffected by withdrawals within the modeled network, although a time pattern can change that head.[2]
Representing storage as a reservoir therefore removes a dependency that a tank would preserve. Object selection changes the calculation. Even before a solver runs, the model has made a consequential claim about how the physical system behaves.
The next calculation has an appointment
At each hydraulic instant, EPANET balances the network's flow and energy relationships. Its Global Gradient Algorithm solves for the coupled heads and flows. Between solutions, net flow changes tank volumes; those updated levels become inputs to the next solution.[2]
Time advances according to events as well as a configured interval. A tank reaching a limit, a demand-pattern change, or a control action can bring the next hydraulic calculation forward. Water-quality routing typically uses shorter steps than the hydraulic calculation because water can travel through a pipe between hydraulic updates.[2]
Consider a hypothetical tank reaching its pump-control threshold partway through an hour. Continuing the old hydraulic state until the hour ends would carry an obsolete operating condition into later calculations. The simulation needs a new flow solution when the modeled operation changes. Its clock is part of the model's causal structure.
A demand is also an assumption
The hydraulic settings determine what a requested withdrawal means. In demand-driven analysis, EPANET requires the specified demand to be supplied, even if the resulting pressures become negative. Pressure-driven analysis instead makes delivered demand vary with available pressure: zero below a minimum, full demand above a required pressure, and a pressure-dependent amount between them.[2]
These formulations answer different questions. The first can expose pressure problems while imposing a consumption schedule. The second represents a reduction in delivery under inadequate pressure. Neither choice discovers the right pressure thresholds from the pipe layout. A successful numerical solve still needs its assumptions to be read alongside its results.
What travels between hydraulic events
The quality solver tracks water in segments with associated volumes and concentrations. As water moves, segments enter and leave pipes; reactions can change their contents. When a hydraulic solution reverses a pipe's flow, the segment order reverses too. Transport therefore retains a history that a single pressure snapshot cannot supply.[2]
EPANET's quality modes include chemical concentration, water age, and source tracing. Its core chemical model can account for reactions in the water and at pipe walls. Interactions among multiple species belong to the separate EPANET-MSX extension.[1] The word quality here identifies modeled quantities and processes; it does not turn a network calculation into a laboratory measurement.
The API exposes the handoff
The 2.2 toolkit makes the sequence available to other programs. After opening and initializing the hydraulic solver with EN_openH and EN_initH, a caller alternates EN_runH with EN_nextH. The first computes the current solution; the second supplies the interval to the next hydraulic event. That returned interval should be treated as read-only.[3]
Water-quality analysis has its own lifecycle. EN_solveH can generate and save the complete hydraulic history before quality analysis begins. In a quality loop, EN_nextQ advances to the next hydraulic event, while EN_stepQ permits access at individual quality steps. The similar names conceal a meaningful difference in observation frequency.[3]
Saved hydraulics can also be reused through EN_usehydfile for quality analyses under the same hydraulic conditions. This permits a useful kind of experiment: change a water-quality assumption while holding the flow history fixed. Change the conditions governing flow, however, and that reuse no longer represents the same experiment.[3]
The junction that the equations simplify
At pipe junctions, the standard quality model assumes incoming water mixes completely and instantaneously. It calculates the outgoing concentration from the incoming mass and water volume.[2] That compact rule gives the network solver something tractable to compute at every junction.
Sandia National Laboratories' experiments and computational studies show why the rule deserves scrutiny. In studied cross-junctions, incoming streams could divide according to their momentum and remain incompletely mixed. The resulting concentrations depended on behavior that complete mixing suppresses.[4]
An independent 2022 review by Reza Yousefian and Sophie Duchesne surveys this problem and alternative mixing models. Its institutional abstract emphasizes that the complete-mixing assumption can produce erroneous predictions and that choosing a better model remains only partly resolved.[5] This is a limitation of a physical approximation, not evidence that every EPANET result is unusable.
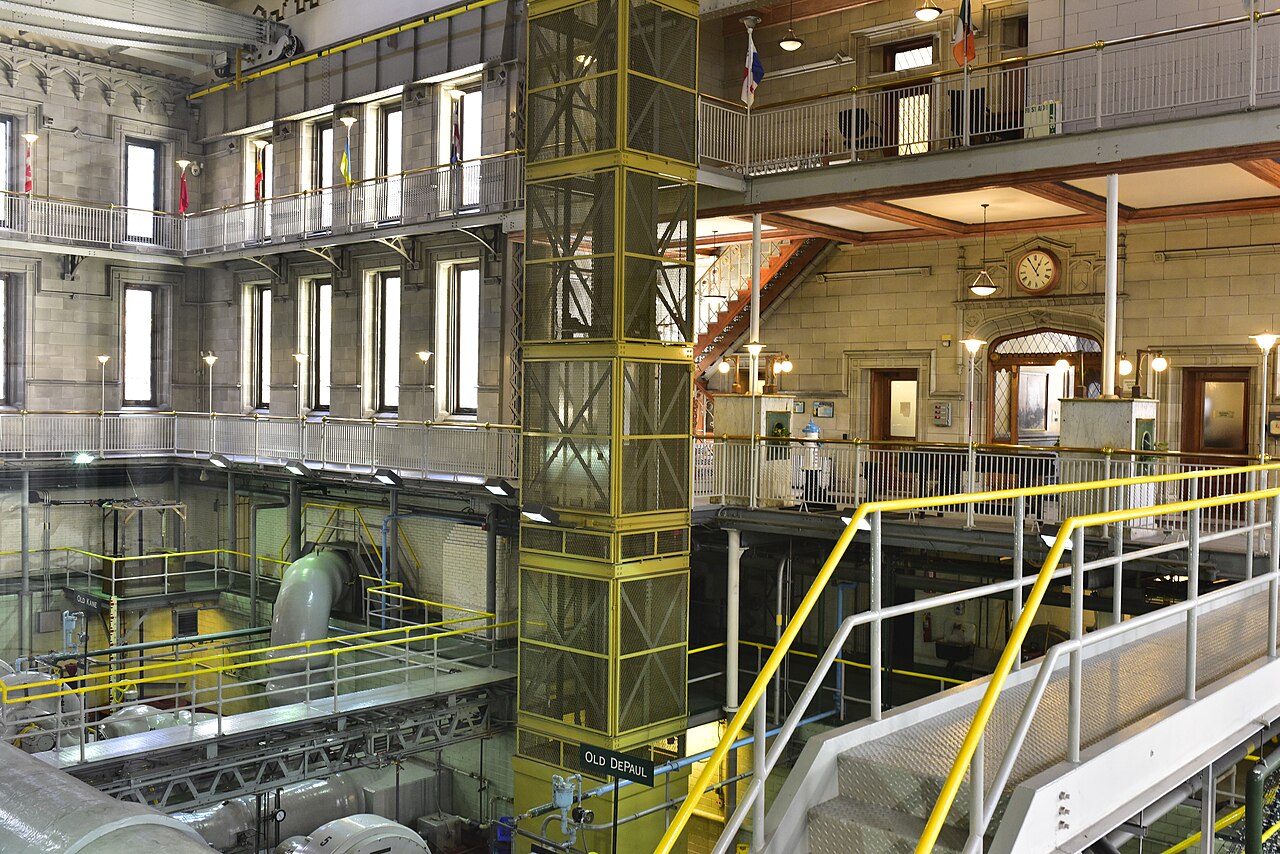
My reading of the architecture is that its openness makes the chain of reasoning inspectable. One can ask which hydraulic history carried the substance, which timestep exposed a change, and which mixing rule determined the concentration. Those questions connect the output back to the machinery and pipework in the photograph. The useful result is a prediction whose dependencies can be examined closely enough to know what additional evidence it needs.
Sources
- U.S. Environmental Protection Agency, “EPANET” — official release dates, open-source status, modeling scope, water-quality capabilities, and extensions.
- U.S. Environmental Protection Agency, EPANET 2.2 User Manual — network objects, hydraulic and quality models, configuration, and algorithms: Chapter 3, “The Network Model”, Chapter 8, “Analyzing a Network”, and Chapter 12, “Analysis Algorithms.”
- OpenWaterAnalytics, EPANET v2.2,
include/epanet2_2.h— version-pinned API documentation for hydraulic and quality solver lifecycles, event intervals, and hydraulic-file reuse. - Sandia National Laboratories, “Water Distribution Systems: Solute Transport and Mixing” — experimental and computational evidence for incomplete mixing at pipe junctions.
- Reza Yousefian and Sophie Duchesne, “Modeling the Mixing Phenomenon in Water Distribution Networks: A State-of-the-Art Review,” Journal of Water Resources Planning and Management 148(2), 2022 — institutional bibliographic record and abstract of an independent review.
- Rwittebort, “Chicago Water Tower Pumping Station Interior,” October 17, 2017, Wikimedia Commons — photograph of Chicago Avenue Pumping Station; CC BY-SA 4.0.