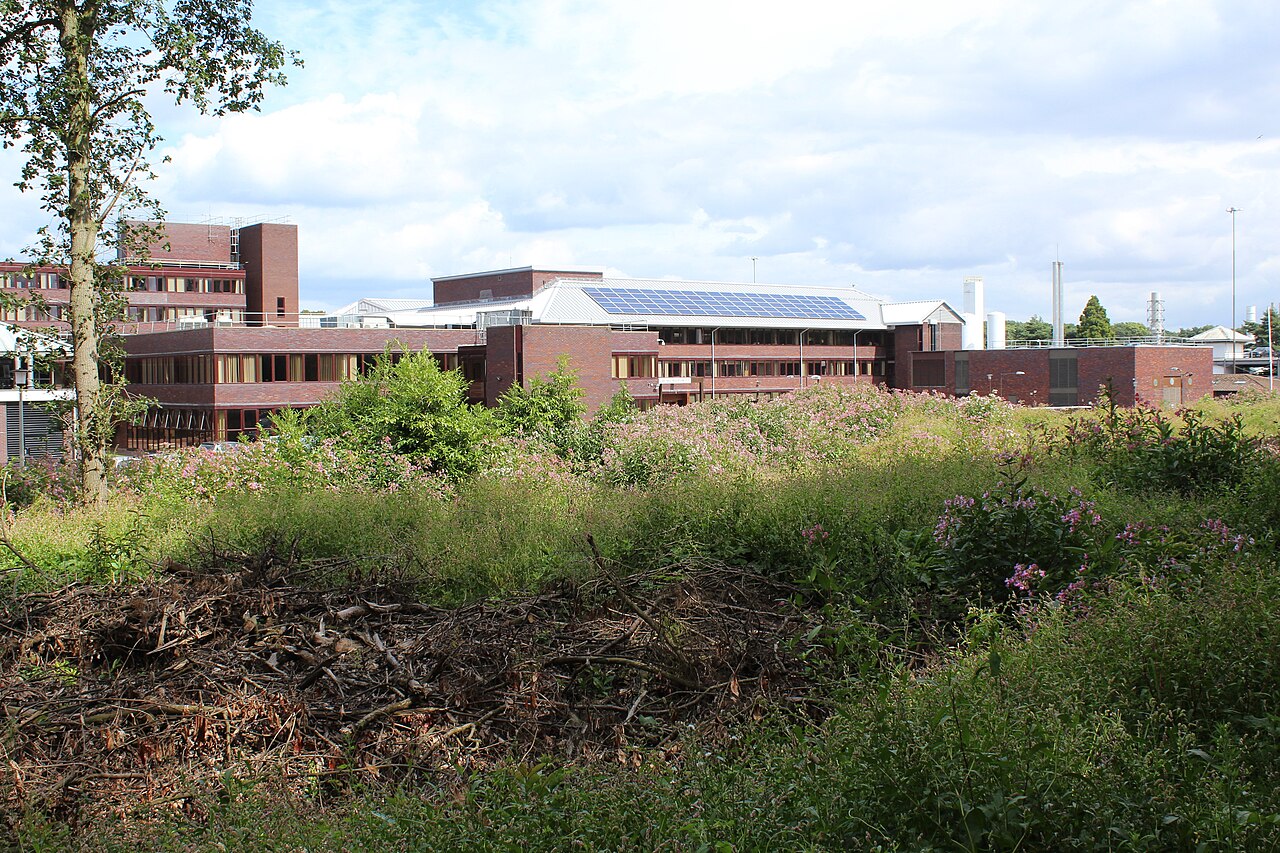
As of 2026-09-28 22:35 UTC. Britain's employment recovery after the pandemic may have been stronger than its household survey suggested, according to research published today by the Office for National Statistics. Linking payroll records to survey responses produced a different account of the recovery, with employment higher and economic inactivity lower during parts of the period.[2]
The study covers Great Britain from 2019 through 2025. ONS describes it as experimental research; routinely published labour-market statistics remain the figures users should use.[1]
The recovery looks different when the weights change
In their September 28 explanation, ONS officials Liz McKeown and Daniel Ayoubkhani highlighted three findings:[2]
- Early 2024: incorporating payroll information into survey weights raised the estimated employment rate by 0.8 percentage points relative to the existing series.
- Peak pandemic: the adjustment moved employment rates downward, reversing the direction of the later effect.
- 2025: applying the method made little difference to the employment rate.
These are comparisons between methods for estimating past conditions. They do not describe jobs created or lost today. The changing direction also matters: a correction applied uniformly across the whole period would miss the pattern the research identifies.
The Resolution Foundation has separately constructed an employment series using tax records and population estimates. Its September assessment describes a faster post-pandemic recovery, followed by falling employment rates from 2023, while the LFS series was broadly flat.[4] Agreement at the end of a period can therefore conceal disagreement about the journey there.
What payroll records can reveal
Imagine a survey that gets the right mix of ages and neighbourhoods, but within those groups working people become less likely to reply. Matching the demographic totals would still leave employment undercounted. The Resolution Foundation identifies precisely this kind of within-group difference as a weakness that existing survey weights cannot necessarily remove.[4]
ONS matched survey respondents to payroll records, aligned employee definitions and adjusted population coverage. It then tested adding payroll information to the survey weights.[1]
Payroll data have strengths because employers submit records when paying staff, independently of whether those employees answer a household survey. But the records describe payments: statisticians must estimate the periods of work they represent. They also exclude self-employment income outside payroll, and early estimates require imputation for missing submissions before later revisions arrive.[3]
That boundary preserves an essential role for interviews. The Resolution Foundation notes that its tax-based approach cannot independently distinguish unemployment from inactivity: that requires information about whether someone is seeking work and available to start.[4] A missing payslip cannot answer those questions.
Evidence of improvement, with limits
Population estimates and other systematic differences may still affect the comparison. Payroll status is weakly correlated with unemployment status, and the true employment rate remains unknown. The study excludes Northern Ireland pending fuller data linkage.[1]
There is also a separate question of detail. In its April review, the Office for Statistics Regulation welcomed larger LFS samples but reported that these still did not support more detailed regional or devolved analysis. It also highlighted attrition and breaks in some longitudinal series.[6] Better national agreement cannot, by itself, establish that every local estimate or transition between jobs is reliable.
The latest regular bulletin, published September 15, put the UK employment rate for people aged 16–64 at 75.1% for May–July 2026. It continued to recommend payroll data as the most reliable employee measure while retaining the LFS for unemployment, inactivity and self-employment.[5] Those complementary roles remain useful when reading today's research.
What happens next
For analysts and editors, the next 24 hours call for careful labelling; the next seven days, for comparisons aligned by geography and period. Within 30 days, October 20 brings the next scheduled labour-market release. Adoption of the experimental method remains undecided.[1][5]
The conditional paths are straightforward:
- Base: further testing proceeds while the regular series remains in use.
- Upside: tests on newer data and the transformed survey show that the approach improves estimates and can meet publication deadlines.
- Downside: revised population assumptions, linkage problems or late payroll records materially weaken its usefulness.[1]
Before updating a briefing: retain the official series, label any experimental comparison, and check for methodological revisions. If subsequent testing reverses the apparent improvement, the case for adoption would weaken. Today's result supplies a promising way to examine the survey's blind spots; its operational value still has to be demonstrated.
Sources
- ONS, “Investigating non-response to the Labour Force Survey using administrative data” (September 28, 2026).
- Liz McKeown and Daniel Ayoubkhani, ONS, “Building a clearer picture of the labour market by integrating survey and administrative data” (September 28, 2026) — findings and interpretation.
- ONS and HMRC, “User guide to earnings and employment from Pay As You Earn Real Time Information” (July 25, 2025) — coverage, timing and revisions.
- Resolution Foundation, “Estimates of UK employment” (September 2026 edition) — independent estimates, non-response and limits of tax data.
- Office for National Statistics, “Labour market overview, UK: September 2026” (September 15, 2026) — current figures, user guidance and release calendar.
- Office for Statistics Regulation, “Update report Labour Force Survey Transformation” (April 29, 2026) — sample recovery and continuing quality concerns.
- M J Roscoe, “Office of National Statistics, Newport” (August 8, 2016), Geograph / Wikimedia Commons — archival photograph, CC BY-SA 2.0.