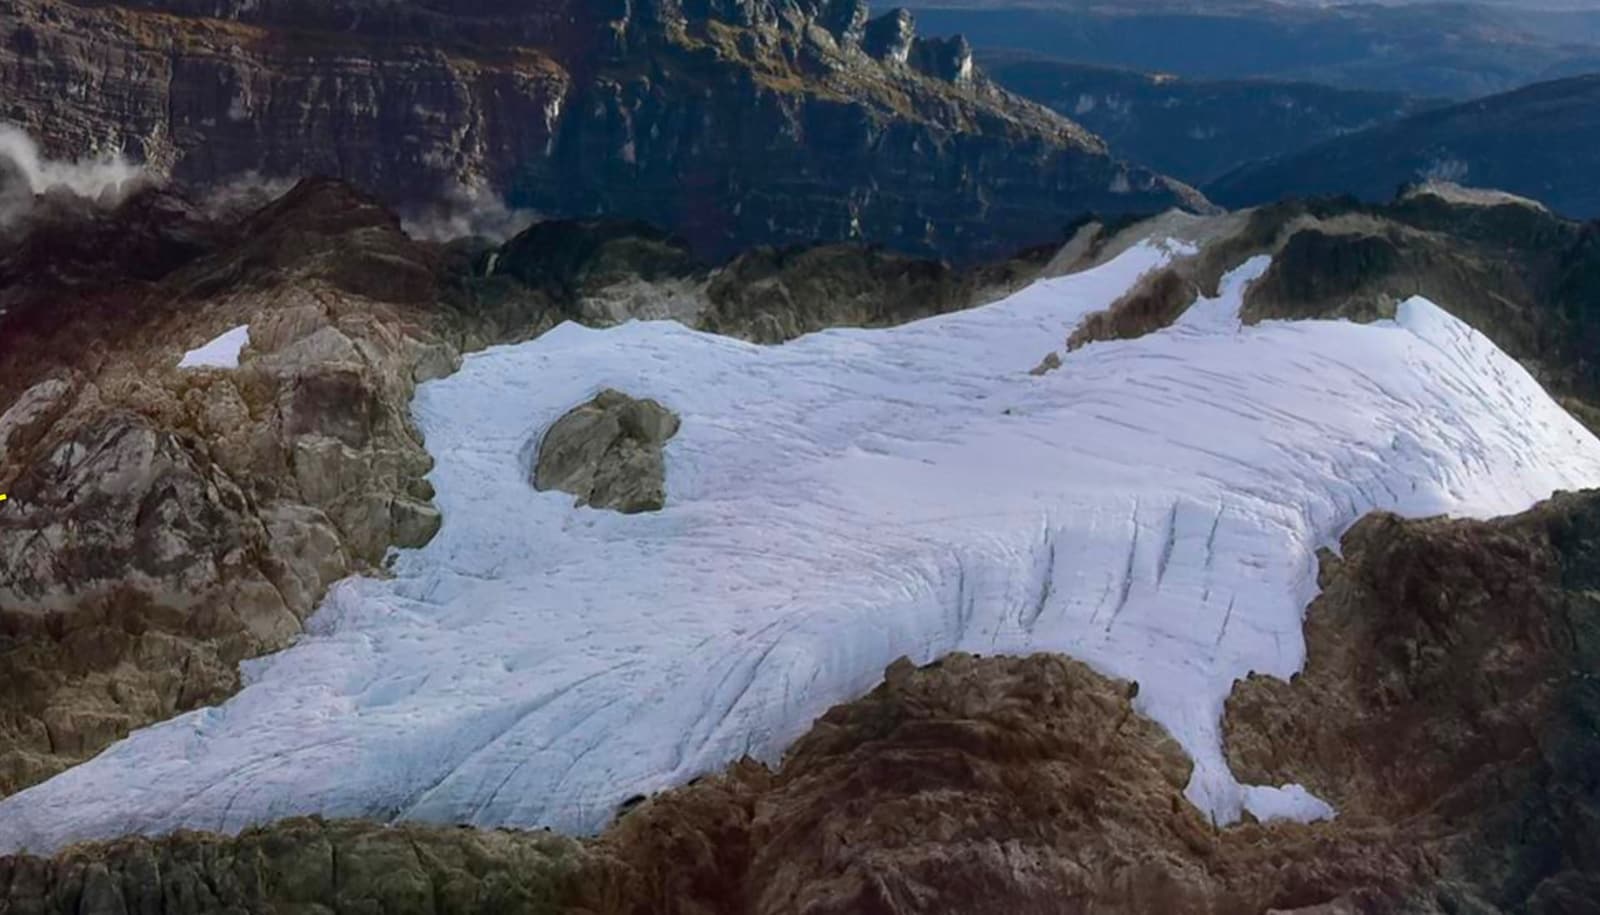
As of 2026-07-13 00:37 UTC, the World Meteorological Organization says the last tropical glacier in the South-West Pacific may disappear by the end of 2026 or early 2027. Its new regional climate report estimates that Papua's remaining tropical ice in 2025 was about 2% of its 1988 area.[1]
That forecast should trigger more than another extinction countdown. Indonesia and its scientific partners should fund a continuous, openly archived last-ice record now: repeat field measurements where access is safe, high-resolution surveys when cloud permits, explicit uncertainty, and preservation of the raw observations as well as the finished maps.
This is not a proposal to document the glacier instead of slowing climate change. Monitoring will not cool the mountain. It is an argument that allowing an irreplaceable climate archive to vanish between occasional expeditions would add an avoidable loss of knowledge to the physical loss already under way.
Fact File
| Signal | What the evidence supports | Boundary |
|---|---|---|
| WMO's July 7 assessment | The remaining ice was about 2% of its 1988 area in 2025, with disappearance expected by the end of 2026 or early 2027.[1] | This is a forecast window, not an observed date of extinction. |
| High-resolution 2023–24 mapping | A peer-reviewed survey measured total glacier area at 0.165 ± 0.008 km² in 2024, down about 65% from 2018, and projected disappearance around 2030 if the post-2018 area-loss rate continued.[2] | Optical mapping of tiny ice bodies is constrained by cloud, shadow, terrain and image timing. |
| Four decades of Landsat | A separate 2026 study estimated 0.19 km² remained in 2024 after a 97% decline from 1980, with two of six named glaciers surviving and both projected to disappear by 2030.[3] | Different baselines, sensors and delineation methods should not be collapsed into false decimal-level agreement. |
| Field evidence | BMKG reported that measured ice thickness fell from six metres in December 2022 to two metres in December 2023; earlier work found the strong 2015–16 El Niño sharply accelerated thinning.[5][7] | A stake record measures one location. It cannot by itself describe the volume or fate of every fragment. |
| Archive already begun | Researchers have published recent and historical glacier outlines in the PANGAEA repository, including digitized extents from 1850 onward.[4] | Open outlines are valuable, but they do not replace repeated thickness, weather and surface measurements. |
The Date Is Not the Science
The WMO's 2026–27 window and two peer-reviewed estimates pointing toward 2030 may look like disagreement about whether the glacier has months or years left. Read properly, they make the same larger finding: the remaining bodies are tiny, rapidly retreating and close to disappearance.[1][2][3]
The final calendar year is harder. David Ibel and colleagues found that total area fell from about 19.3 km² in 1850 to 0.165 km² in 2024. They also described a recent data gap: the last remote surveys before their work covered 2015–18, while extensive expeditions had been rare. Their paper says detailed attribution needs more in-situ data and that very small glaciers increasingly require the highest-resolution imagery available.[2]
Francine Hematang and colleagues used the long Landsat record and arrived at a slightly larger 2024 total, 0.19 km². Their two surviving components did not share one projected end: East Northwall Firn was estimated to disappear in 2028–29 and Carstensz Glacier in 2029–30.[3] Those differences do not make the WMO warning empty. They show why every public forecast should state its observation date, definition of disappearance, data source, method and uncertainty.
A tiny remnant can fragment, acquire debris, hide beneath cloud or be confused with transient snow. A linear extrapolation can also be broken by an unusually warm or snowy season. The honest headline is not that science knows the glacier's final day. It is that the observation interval is becoming dangerously large relative to the glacier's remaining life.
A Glacier Can Disappear Twice
The first disappearance is physical: perennial ice stops functioning as a glacier. The second is evidentiary: the measurements needed to understand its final years were never made, cannot be compared, or survive only in inaccessible files.
Puncak Jaya has already shown what can be rescued. A 2010 field campaign recovered two ice cores roughly 32 metres long that preserve about half a century of tropical Pacific climate variability. The same research used a stake anchored to bedrock to measure thinning and linked a major acceleration to the 2015–16 El Niño.[5] Those records cannot be recreated after the ice is gone.
The public record is much thinner than the white expanse in the 2015 cover photograph suggests. The Guardian's account of a recent Project Pressure survey says the last two major scientific expeditions before it took place in 1973 and 2011. The newer team used drones and satellite positioning to build a three-dimensional model, but persistent rain allowed only brief clear windows.[6] That combination—difficult access, cloud, steep terrain and a shrinking target—is precisely why a repeatable program matters more than a succession of one-off farewell visits.
The existing PANGAEA dataset offers the right principle: publish the geometry and metadata in a repository built for reuse.[4] The next layer should connect those outlines to field photographs, geodetic control points, ice thickness, local weather, uncertainty estimates and a clear chain of custody. Where safety, permissions or terrain prevent a measurement, the archive should say so. A documented gap is more useful than a seamless-looking reconstruction that conceals one.
What a Last-Ice Record Should Be
First, it should be continuous enough to detect the ending, not merely to commemorate it. BMKG's field observations and the two recent mapping studies should become the baseline for a shared schedule that uses satellite passes, drone surveys and ground measurements as complementary tools.[2][3][7] One system sees through another's blind spots; none is complete alone.
Second, it should be open by default. Derived maps are not enough. Repositories should retain raw or minimally processed imagery where permissions allow, processing steps, coordinate systems, delineation rules, error ranges and version histories. Future researchers need to know not just what boundary was drawn, but why.
Third, it should be Indonesian-led and locally governed. International expertise and instruments can help, but a final archive cannot become an extractive trophy assembled elsewhere. Decisions about access, cultural testimony, naming, photography and public presentation should involve the institutions and communities connected to the mountain. Scientific openness does not erase consent or security.
Finally, it should keep observation and mitigation in their proper places. A perfect three-dimensional model would preserve form, not ice. The retreat sits inside a warming climate, and a better archive does not weaken the case for cutting emissions. It sharpens it by leaving a record that can be inspected rather than a date that can only be repeated.
Decision Impact
Next 24 hours: WMO should publish or point directly to the methodological note behind the 2% estimate and the 2026–27 window, including the date of the underlying observation and what counts as disappearance.[1] The forecast would become more credible, not less urgent, if readers could see its uncertainty.
Next 7 days: BMKG, Indonesian universities and the recent study teams should identify which 2023–26 observations can be joined without pretending their methods are identical. The immediate product can be a public inventory: dataset, owner, coverage date, resolution, access condition and known gap.[2][3][4][7]
Next 30 days: WMO and research funders should support at least one coordinated final-phase monitoring plan with repeat measurements, an open repository and a long-term custodian. The plan should survive beyond the last successful field visit; otherwise the archive will end when project funding does.
Three Possible Records
Base case — a well-mapped outline, an incomplete ending. Satellites continue to show retreat, but cloud and infrequent field access leave the final thickness and mass changes uncertain. Researchers infer disappearance retrospectively from the last usable images.
Better case — a comparable final series. Coordinated high-resolution imagery, georeferenced drone surveys, field measurements and weather observations produce a versioned record through fragmentation and loss. Methods and uncertainties remain visible, and Indonesian institutions hold durable copies.[2][4][6]
Worse case — a confident date with no audit trail. Public attention fixes on 2026, 2027 or 2030 while the underlying observations remain scattered. Seasonal snow or cloud obscures the transition, and the glacier's "last year" becomes a claim that later researchers cannot reproduce.
Action Checklist
- Define disappearance before announcing it: no mapped perennial ice, loss of glacier flow, or another explicit threshold.
- Publish the observation date beside every remaining-area estimate; a 2025 report can still rely on imagery from an earlier season.
- Keep raw data, processing code or steps, field logs, uncertainty and failed observations together with the finished outline.[2][4]
- Use the 2015 photograph and newer survey imagery as dated evidence, never as interchangeable illustrations of present conditions.[6]
- Build local governance, consent and long-term Indonesian custody into the archive from the start.
- Treat monitoring as evidence infrastructure, not a substitute for emissions cuts.
The argument should be revised if a public, coordinated program already supplies this full chain from raw observation to durable archive. Until then, the discrepancy between "next year" and "around 2030" is not a reason to wait for a cleaner headline. It is the reason to measure now.
Sources
- World Meteorological Organization, "Ocean warming, marine heatwaves and sea-level rise pose increasing risk in South-West Pacific region" (July 7, 2026) — current regional assessment, 2% estimate and 2026–27 disappearance window.
- David Ibel, Thomas Mölg and Christian Sommer, "Tropical glaciers on Puncak Jaya (Irian Jaya/West Papua, Indonesia) close to extinction," The Cryosphere 19 (2025) — high-resolution 2023–24 mapping, historical reconstruction, uncertainty and monitoring limits.
- Francine Hematang et al., "Rapid retreat of tropical glaciers in Puncak Jaya, Papua: Four decades of change observed from Landsat Imagery, 1980–2024," Cold Regions Science and Technology (2026) — four-decade area series and component-level projections.
- David Ibel, Thomas Mölg and Christian Sommer, PANGAEA dataset, "Surveying tropical glacier change on Puncak Jaya ... publishing updated map of change 1850–2024" (2025) — openly archived glacier outlines and historical extents.
- Donaldi S. Permana et al., "Disappearance of the last tropical glaciers in the Western Pacific Warm Pool (Papua, Indonesia) appears imminent," Proceedings of the National Academy of Sciences 116 (2019) — field stake, ice-core and El Niño evidence.
- Ajit Niranjan, The Guardian, "Witnessing the disappearance of Indonesia's 'eternity glaciers'" (May 27, 2026) — recent expedition reporting, survey constraints and source page for the 2015 Global Atmosphere Watch cover photograph.
- ANTARA News, "Puncak Jaya's glaciers shrank to 0.23 square kilometers by 2022: BMKG" (April 18, 2024) — Indonesian agency field observations and the 2022–23 thickness change.