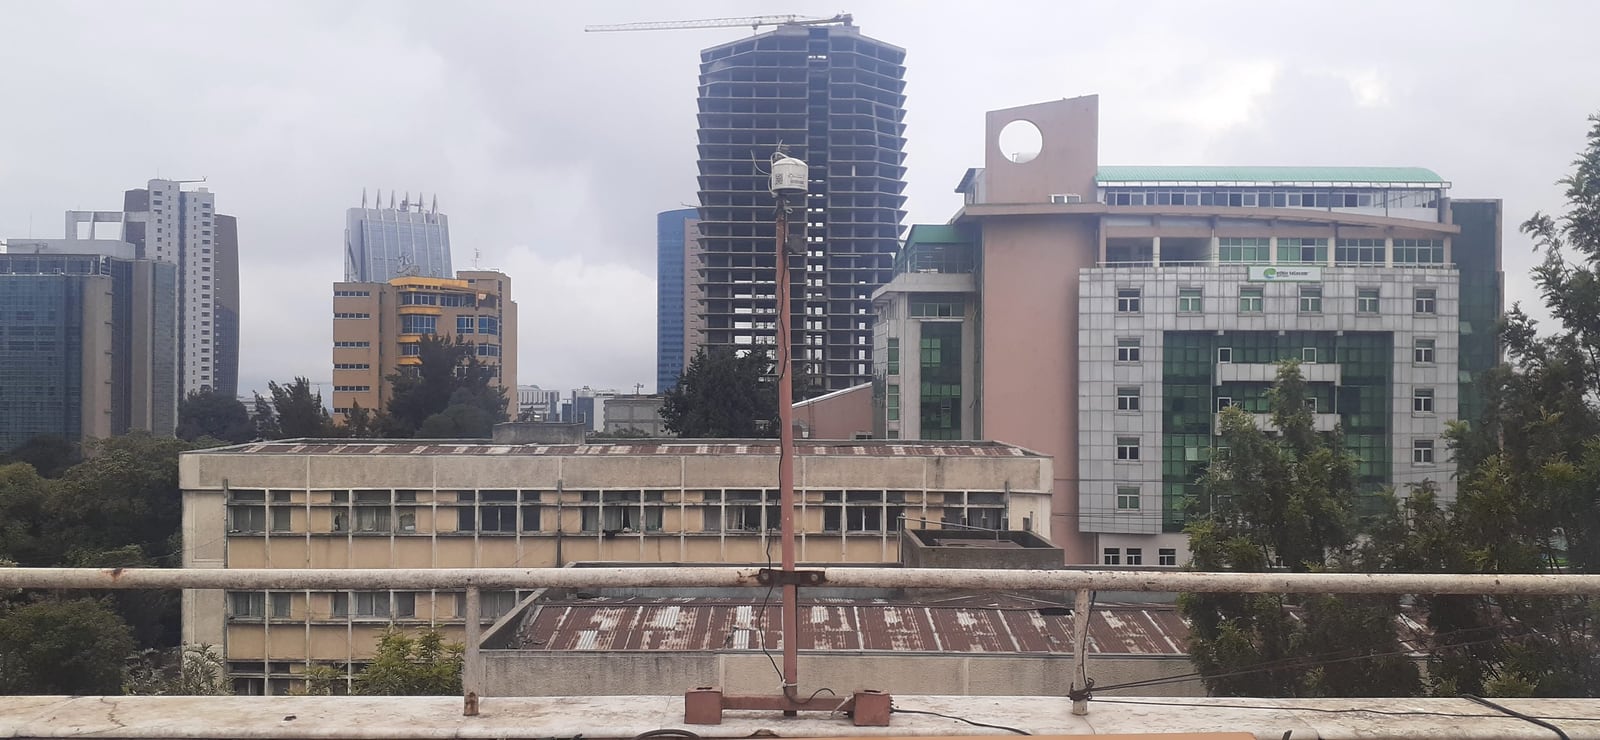
As of 2026-08-17 23:40 UTC, NASA had published a report on three years of air measurements from Addis Ababa. The study behind it calls the record Ethiopia's first long-term, continuous, multisite characterization of fine particulate matter and source-apportioned black carbon.[1][2]
The headline number is severe: from April 2022 through March 2025, average PM2.5 across 10 monitoring sites was 30 micrograms per cubic meter. That is six times the World Health Organization's annual guideline value of 5 micrograms per cubic meter. Daily concentrations exceeded the WHO's 15-microgram guideline on 99% of measured days.[2][6]
This is not a live reading, a national average or proof that one policy has succeeded or failed. It is something more useful than a political applause line: a baseline.
Ethiopia prohibited imports of gasoline and diesel vehicles in January 2024. It has since registered a national directive that requires covered fuel-burning vehicles already on the road to meet emissions standards and undergo annual emissions checks.[3][4] Those are consequential inputs. They should not become their own report card. The outcome to publish is what people breathe.
What the new evidence establishes
| Signal | Time and source | Verified finding | Confidence and boundary |
|---|---|---|---|
| PM2.5 level | April 2022–March 2025; peer-reviewed study released online July 13, 2026 | The mean across 10 Addis Ababa sites was 30 µg/m³; the WHO daily guideline was exceeded on 99% of measured days.[2][6] | High for the study network. It is not a current reading, an Ethiopia-wide average or a causal estimate of any vehicle policy. |
| Black-carbon source estimate | Two instrumented sites within the same study | An Aethalometer model attributed an average 94% of measured black carbon to fossil-fuel combustion and about 6% to biomass burning.[2] | Moderate. The result comes from two sites and a two-source model with stated assumptions. It does not mean cars caused 94% of PM2.5. |
| Import policy | In force since January 2024; IEA record updated April 28, 2026 | Ethiopia prohibits imports of gasoline and diesel vehicles, with electric mobility and reduced fuel imports among the policy aims.[3] | High on policy status. Import rules change additions to the fleet; they do not remove vehicles already operating. |
| Existing-fleet rule | Directive No. 1051/2025, registered January 28, 2026 | The directive covers vehicles required to undergo annual inspection nationwide and requires annual pollutant-emissions testing and compliance certificates.[4] | High on the text. The directive does not itself show inspection coverage, pass rates, enforcement quality or ambient-air effects. |
| Next measurement layer | Mission status at the cutoff | MAIA combines a ground-monitor network with a satellite observatory now scheduled to launch no earlier than late 2027; surface measurements help turn remotely sensed aerosol properties into estimates near the ground.[1][5] | High on mission design. A future spacecraft expands spatial coverage; it does not make ground monitors optional. |
The distinctions in the final column matter. “Fossil fuel” is not a synonym for “tailpipe.” Diesel vehicles are plausible contributors, but so are generators and other combustion sources. Black carbon is also only one component of PM2.5. The source-apportionment instruments operated at the Central and Jacros sites, not all 10 locations, and the model separates two broad combustion categories by assumptions about how particles absorb light.[2]
So the 94% result is a reason to investigate fossil-fuel combustion aggressively. It is not permission to print “cars cause 94% of Addis Ababa's air pollution.”
A ban is an intervention, not an outcome
The import prohibition can improve the composition of vehicles entering Ethiopia while doing little immediately to retire an older combustion fleet. The annual inspection directive addresses that second problem on paper: fuel-burning vehicles in service must be tested, vehicles that fail must be brought into compliance, and certificates attach the rule to the technical-inspection system.[4]
But neither an electric-vehicle count nor an inspection certificate measures ambient exposure. A cleaner incoming fleet can be offset by population growth, more total journeys, congestion, dusty construction, generator use, waste burning or unfavorable weather. Conversely, a fall in PM2.5 after the ban would not by itself prove the ban caused the decline. Rain, wind, economic activity, fuel supply and changes in other sources can all move the series.[2]
The study itself demonstrates why a single-policy story is inadequate. Morning traffic coincided with pollution peaks, but nighttime inversions and wet-season conditions also mattered. During the Meskel and Hidar Sitaten celebrations, hourly PM2.5 at the two detailed sites repeatedly exceeded 200 µg/m³; the instruments distinguished a temporary burning signal from the usual fossil-fuel-dominated black-carbon pattern.[1][2] Electrifying vehicle imports cannot solve an episodic bonfire plume. Managing burning cannot replace control of routine combustion.
This does not weaken the case for vehicle policy. It defines what serious evaluation looks like.
The scorecard Addis Ababa now needs
The 10-site study should become the spine of a public air-quality scorecard, whether the same instruments remain in place or an Ethiopian agency builds the durable successor. The first page should report outcomes, not slogans:
- monthly and annual PM2.5 at each continuing site, alongside network-wide summaries;
- the share of valid hours and days, sensor downtime, calibration dates and method changes;
- daily guideline exceedances, with seasonal and meteorological context;
- black-carbon measurements and source estimates where research-grade instruments support them, with uncertainty displayed;
- separately, fleet composition, annual inspections completed, failure rates, retests and enforcement actions.
Keeping the exposure series and the policy series separate is essential. Officials need both to test whether cleaner vehicles and inspections coincide with cleaner air. Combining them prematurely—by treating more EVs as proof of lower exposure—would erase the very question the network can answer.
The comparison also needs stable geography. The study found higher PM2.5 at central and western sites than at locations on the city's edges.[2] A citywide average can improve while a high-exposure corridor does not. Publishing site-level data, with privacy and security safeguards where necessary, would let residents and researchers see whether benefits reach the places with the highest baseline.
WHO guideline values are useful health benchmarks, not a substitute for Ethiopia's legal standards or a promise that every monitor can be compared without adjustment.[6] The scorecard should preserve raw units, methods and completeness rather than collapse everything into a single colored badge.
Do not wait for the satellite
NASA's MAIA observatory is not expected to launch before late 2027. Waiting for it would reverse the mission's logic. JPL says the project will combine satellite observations with ground measurements and models to produce daily particulate-matter maps; surface monitors are needed to translate what the camera sees in the atmospheric column into concentrations near people.[1][5]
The ground network is therefore not temporary scaffolding to discard when a spacecraft arrives. It is calibration infrastructure before launch, validation infrastructure afterward and a direct local record when cloud or orbit limits a satellite view.
NASA's August 17 report says the sensors are already in operation, but the public pages reviewed for this article do not establish a permanent Ethiopian funding line, a guaranteed 10-site configuration or a fixed public-release calendar.[1][5] That uncertainty should be resolved in public. The worst version of this story would be a celebrated baseline followed by a gap just when policy effects become measurable.
Decision impact: 24 hours, 7 days, 30 days
Next 24 hours — state the network's status. The MAIA team and the relevant Ethiopian environmental and transport authorities should identify which of the 10 sites are operating now, who owns each data stream, how frequently instruments are calibrated and where validated observations can be obtained. If data cannot yet be released, the limitation and expected release date should be explicit.
Next 7 days — publish the baseline as a scorecard, not only a paper. A compact table should reproduce the study period, site coverage, 30 µg/m³ network mean, data-completeness rules, daily exceedance frequency and the two-site boundary on black-carbon attribution. Transport authorities should publish matching definitions for vehicle imports, registrations and emissions inspections so later comparisons retain stable denominators.[2][3][4]
Next 30 days — secure continuity and pre-register the test. Agencies should name a long-term network operator, budget for calibration and replacement, set a release schedule and specify in advance how they will assess trends after the 2024 import ban and 2026 inspection directive. The design should account for season, weather, site changes and other emission sources; otherwise every rise or fall will invite a convenient causal story.
Three paths to watch
These are conditional branches, not probability estimates.
Base path — policy inputs rise, but the exposure record stays episodic. EV imports, chargers and inspection activity generate regular announcements while air measurements appear mainly in research releases. Trigger: authorities can report vehicle counts but cannot point to a current, quality-controlled, multisite PM2.5 series with a publication calendar.
Upside path — the baseline becomes accountable public infrastructure. A stable network publishes validated observations, the existing fleet's inspection results become auditable, and several years of seasonally comparable data show falling exposure across both central and peripheral sites. Trigger: sustained improvement appears across high-completeness monitors and survives adjustments for weather and network changes—not merely one clean month.
Downside path — the baseline becomes an orphan. Sites go offline, calibration lapses or the network changes without an overlap period, leaving no defensible bridge from 2022–2025 to later policy years. Trigger: unexplained data gaps, shrinking site coverage or a satellite-era plan that omits surface-monitor maintenance.
What would make the policy test credible
- Environmental authorities name the data steward, publish quality-control methods and preserve continuity at representative background and roadside locations.
- Transport authorities report inspection coverage and outcomes, not only the number of vehicles presented for testing.
- Researchers retain the two-site and model-assumption boundaries on the 94% black-carbon estimate.
- Journalists stop using EV sales or imports as a proxy for exposure and stop translating “fossil-fuel black carbon” into “traffic's share of all pollution.”
- Every trend claim identifies its time window, valid-site count and treatment of weather, seasonality and instrument changes.
The argument here should be revised if the study is corrected, if a documented permanent network and open reporting calendar already cover these needs, or if later validation materially changes the sensor estimates. New observations should supersede the 2022–2025 figures; they should not be spliced onto them without a documented method.
Most important, the baseline does not establish that Ethiopia's import ban has failed. Nor does the existence of the ban establish that the air has improved. It establishes a fairer question than either claim: after the policies, did sustained, quality-controlled exposure fall—and where?
That is the score worth keeping.
Sources
- NASA Jet Propulsion Laboratory, “NASA Mission Studies Air Pollution Over Ethiopia” (August 17, 2026; accessed 23:40 UTC) — current news report, study context, network and launch status, and provenance for the article photograph.
- Kyan K. Shlipak et al., “Spatial and Temporal Trends of Ambient PM2.5 and Source-Apportioned Black Carbon in Addis Ababa, Ethiopia,” ACS ES&T Air (published online July 13, 2026) — methods, measurements, source model, limitations and event-level results.
- International Energy Agency, “Ban on import of internal combustion engine vehicles” (updated April 28, 2026) — status, timing and stated policy context for Ethiopia's gasoline- and diesel-vehicle import prohibition.
- Federal Democratic Republic of Ethiopia Ministry of Justice, “Directive on Emission Control of Pollutants From Vehicle No. 1051/2025” (registered January 28, 2026) — official record and linked English directive covering scope, annual testing and compliance obligations.
- NASA Jet Propulsion Laboratory, “The MAIA Mission” — official explanation of the observatory, surface-monitor network and the combination of satellite, ground and modeled data.
- World Health Organization, “Air quality, energy and health: types of pollutants” — 2021 annual and 24-hour PM2.5 guideline values used as health benchmarks.