As of 2026-10-27 19:34 UTC.
The atmosphere accumulated carbon dioxide more slowly in 2025, but still finished with a higher annual average. The World Meteorological Organization’s bulletin, released October 27, puts the globally averaged surface concentration at 426.8 parts per million, a new record. Its arrival before November’s COP31 climate conference makes the distinction between slower accumulation and falling emissions especially consequential.[1]
A better annual growth figure can carry several stories: less carbon released, more absorbed by land and ocean, or some combination of the two. The policy question is which improvement can endure. Reading an atmospheric measurement as a direct score for emissions policy skips that question.
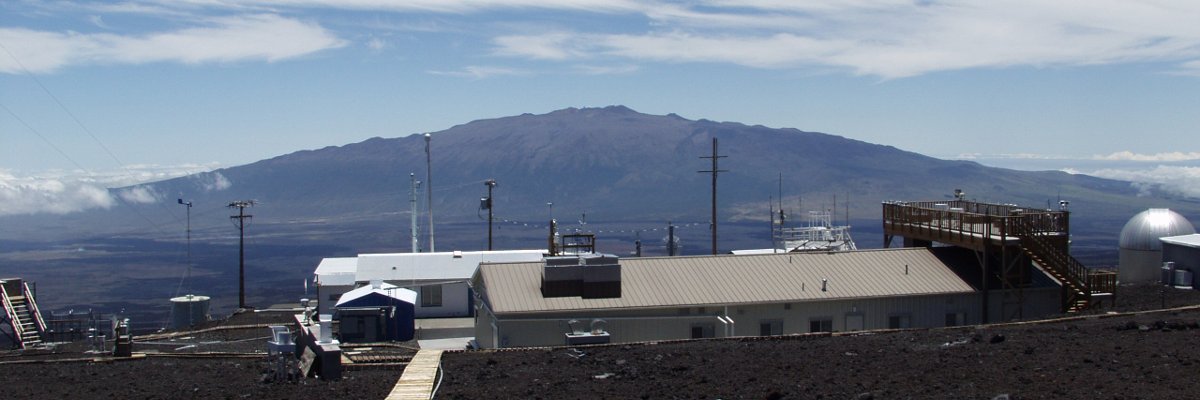
What the new measurements establish
The bulletin’s three principal observations concern the amount of gas already present in air:
- Carbon dioxide: 426.8 ± 0.2 parts per million in 2025, about 53% above the pre-industrial level. Its increase was smaller than the exceptional rise a year earlier, but slightly above the 2016–2025 average.
- Methane: 1,948 ± 2 parts per billion, also a record, although its annual increase slowed.
- Nitrous oxide: 339.1 ± 0.1 parts per billion, another record; its annual increase was unchanged from the previous year.[2]
These are observational estimates with stated uncertainties. They establish rising concentrations; identifying how much each source and sink contributed requires additional evidence. Parts per million and parts per billion describe the composition of air, whereas emissions inventories measure quantities released over a period. The two answer different questions.[2][4]
A recovery in nature can obscure the emissions signal
WMO attributes the more modest CO₂ increase partly to recovering land carbon uptake and lower fire emissions after the strong 2023–2024 El Niño. Drought, dry vegetation and fires had weakened the biosphere’s contribution during that episode. The organisation also warns that the developing 2026 El Niño could again affect land sinks. That is a forward-looking risk, separate from the completed 2025 measurements.[1]
This helps explain why a quieter year in the atmosphere need not mean a decisive change at power stations, factories or fuel pumps. Vegetation and soils can change how much carbon remains airborne even when fossil emissions move in the opposite direction.
The peer-reviewed Global Carbon Budget 2025, published in May 2026, supplies a useful comparison. Its preliminary estimates put 2025 fossil CO₂ emissions at 38.1 billion tonnes, about 1.0% above 2024. Yet total emissions, including land-use change, were estimated slightly lower: 42.2 billion tonnes against 42.4 billion. The paper also anticipated a recovery in land uptake. These remain the paper’s estimates, with uncertainty, rather than a final accounting supplied by today’s bulletin.[4]
The combination matters more than any isolated percentage. Fossil emissions, land-use emissions and natural uptake can move differently in the same year. A policy claim that names only the atmospheric slowdown leaves readers unable to tell which part changed.
The accumulated burden still matters
NOAA’s updated Annual Greenhouse Gas Index offers a second perspective. It estimates that effective radiative forcing from long-lived greenhouse gases—their contribution to the planet’s energy imbalance—was 56% greater in 2025 than in 1990. CO₂ accounted for about 81% of that increase.[3]
That does not mean temperatures rose by 56%, or that total climate forcing increased by that percentage. The index covers a specified group of gases. NOAA explicitly distinguishes it from a forecast incorporating aerosols, solar changes, feedbacks and other influences.[3]
Its value here is to keep attention on what has accumulated. A smaller addition still enlarges the burden. Meanwhile, the annual growth rate is sensitive to changes in the land’s net absorption, including variability associated with El Niño.[3] A single year therefore cannot bear the full weight of judging a long-term transition.
For someone evaluating climate policy, the practical implication is to read three records together: emissions, atmospheric concentrations and estimates of natural uptake. Agreement across them is more informative than a favorable movement in one.
A record level does not make emissions cuts futile
The opposite misreading is equally damaging: assuming that another record proves reductions achieve nothing. Cutting the amount added can slow accumulation before concentrations decline. The relevant comparison is with the larger cumulative emissions that would otherwise occur.
The IPCC’s assessment explains the longer-term endpoint. Reaching and sustaining global net-zero CO₂ emissions would stabilize CO₂-induced warming; strong reductions in other greenhouse gases are also needed to halt overall human-caused warming. In this definition, human-caused CO₂ emissions are balanced by human-caused removals.[5]
A favorable year for natural absorption is not equivalent to reaching that balance. Nor does the persistence of previously emitted carbon imply that every increment of future warming is unavoidable. The IPCC finds that reaching net zero sooner limits cumulative emissions and the resulting warming.[5]
That distinction changes how progress should be judged. Effective measures need not produce an immediate fall in the atmospheric total to matter. They do need evidence that emissions are being reduced.
What would change the reading before COP31
COP31 is scheduled for November 9–20 in Antalya, Türkiye.[1] For journalists, policy teams and readers following the negotiations, three conditional paths are worth separating. These are analytical scenarios, not forecasts of the talks.
The base case is that emissions remain substantial while natural uptake produces uneven annual growth. Continued positive concentration growth alongside that pattern would support this reading. The upside would be sustained emissions declines across successive inventories, accompanied by slower accumulation: stronger evidence of durable progress. The downside would be renewed weakening of land uptake while emissions stay high, accelerating the atmospheric increase.
Over the coming month, the useful checks are concrete:
- Within 24 hours: label each headline number as a concentration, an emissions estimate or a forcing index; retain its units and comparison period.
- Over seven days: examine claims of emissions progress for their coverage, especially whether they include land-use change, and distinguish preliminary estimates from completed inventories.
- Through COP31: look for implementation evidence behind announced reductions. A claim that the atmospheric slowdown proves successful emissions control fails if it rests only on stronger natural uptake. Conversely, sustained emissions declines would undermine a claim that the transition has made no progress.
Sources
- World Meteorological Organization, “Greenhouse gas levels once again reach record high,” October 27, 2026 — the announcement, land-sink explanation, 2026 risk and COP31 dates.
- World Meteorological Organization, Greenhouse Gas Bulletin No. 22, October 27, 2026 — 2025 global surface concentrations, uncertainties and annual-growth comparisons.
- NOAA Global Monitoring Laboratory, “The NOAA Annual Greenhouse Gas Index,” updated fall 2026 — radiative forcing through 2025, the index’s scope and carbon-cycle variability.
- Pierre Friedlingstein et al., “Global Carbon Budget 2025,” Earth System Science Data 18, 3211–3288, May 13, 2026 — executive summary and sections 3.1.4, 3.2.4, 3.4 and 3.7.4; preliminary 2025 emissions and land-sink estimates.
- IPCC, Climate Change 2022: Mitigation of Climate Change, Technical Summary, Box TS.6, page 86 — net-zero CO₂, cumulative emissions and the role of other greenhouse gases; PDF.
- NOAA Global Monitoring Laboratory, “Mauna Loa Baseline Observatory,” accessed October 27, 2026 — the atmospheric monitoring site and source of the archival photograph.