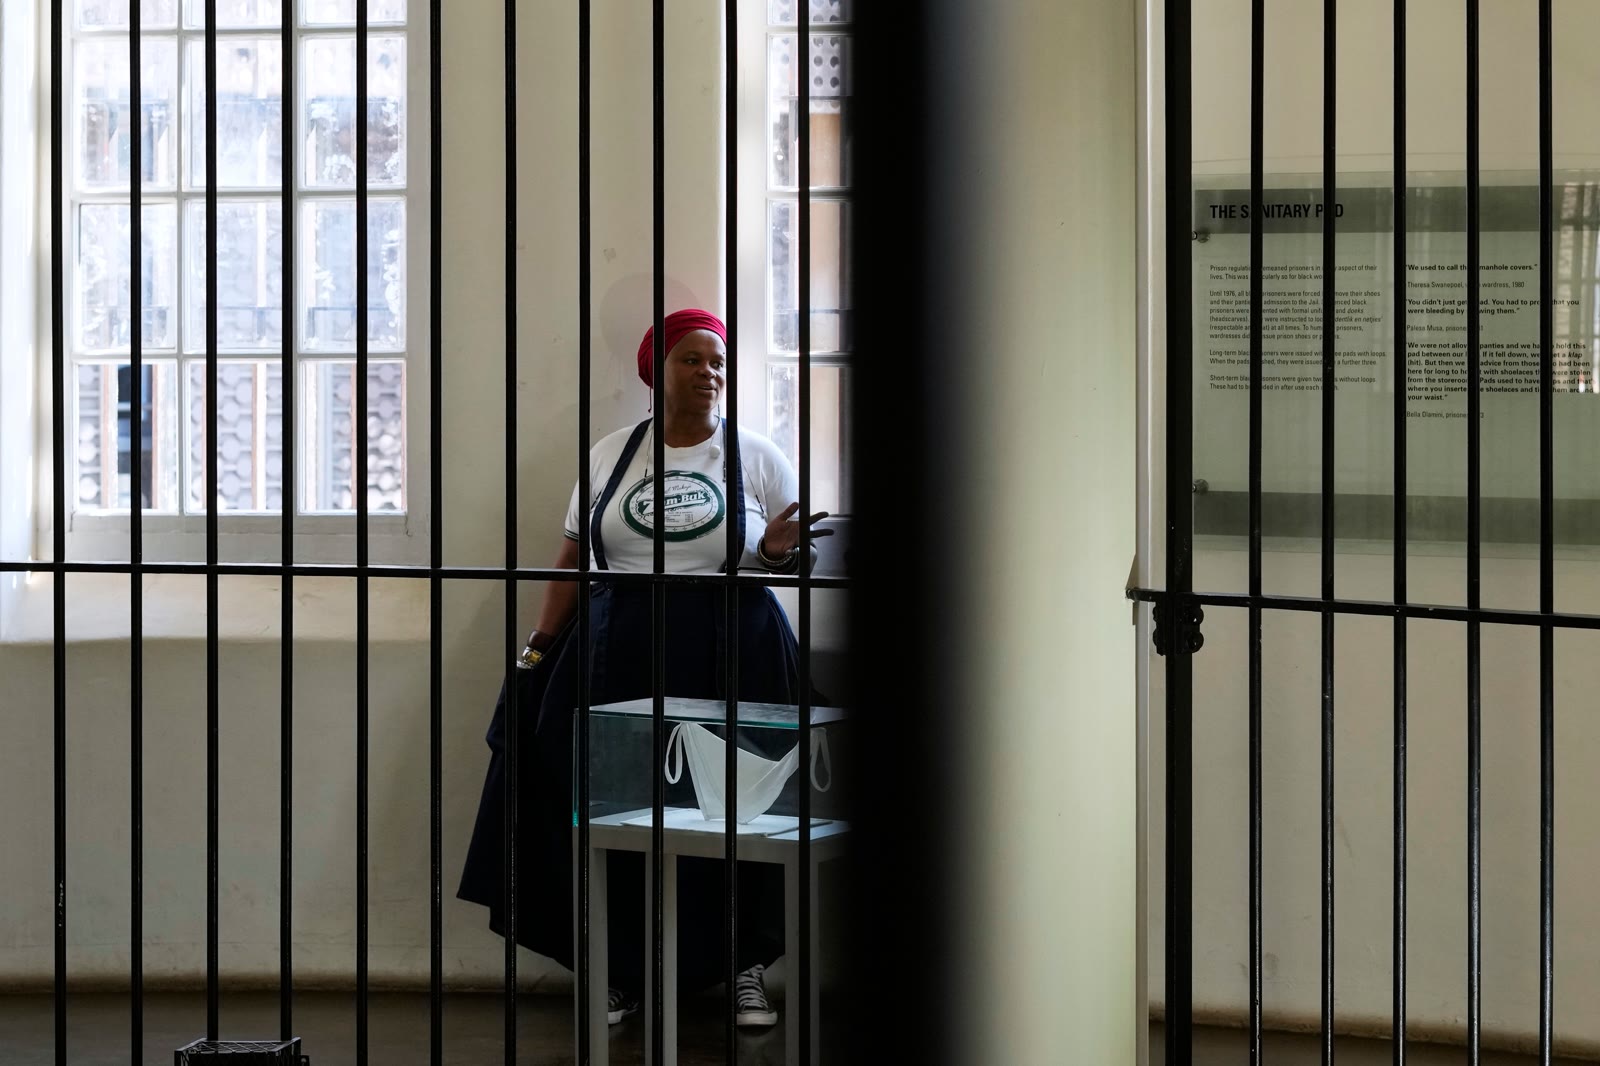
As of 2026-08-09 22:34 UTC, South Africa was marking 70 years since more than 20,000 women converged on the Union Buildings to resist apartheid pass laws. The government's national celebration was scheduled for the same site, with women's access to quality healthcare as an emphasis.[1] The anniversary has a policy instrument more consequential than a commemorative theme: in May, Cabinet approved a Socio-Economic Empowerment of Women Index as an annual national scorecard.[3]
The index could make a fragmented story measurable. But the public rollout documents cited here do not yet show the baseline's numeric scores, indicator definitions, weights, source years or publication calendar. Cabinet has disclosed the broad architecture and which dimensions scored highest and lowest; Parliament has described a baseline scorecard that will enable annual measurement.[3][4] That is evidence of a measure being built, not yet an inspectable measure.
The best 70th-anniversary follow-through is therefore specific: publish the baseline, the method behind it and the public bodies responsible for changing each weak indicator. A scorecard earns authority when anyone can reproduce what it says—and when a lower score changes a decision.
What is established at the cutoff
| Checkpoint | Verified position | Confidence and boundary |
|---|---|---|
| Anniversary event | The national celebration was scheduled for August 9 at the Union Buildings and was framed around empowerment and access to quality healthcare.[1] | High confidence on the official plan. The event notice is not evidence that every scheduled element occurred or that a new implementation deadline was announced. |
| Index status | Cabinet approved implementation of an annual Socio-Economic Empowerment of Women Index on May 6.[3] | High confidence. Approval is not the same as public release of the underlying scorecard. |
| Index design | The public summary names social, economic and decision-making spheres: health and education; labour market and resources; public- and private-sector decision-making.[3] | High confidence at pillar level. The summary does not provide an indicator dictionary, formula or weights. |
| Baseline signal | Cabinet said public-sector decision-making scored highest, while labour market and resources scored lowest. It named female firm ownership, women CEOs at JSE-listed firms, access to credit and high-skill employment among the weakest indicators.[3] | High confidence on rank direction. No numeric pillar or composite score appears in the Cabinet statement. |
| Delivery structure | A parliamentary committee report says the Department of Women, Youth and Persons with Disabilities operates as a centre-of-government department focused on leadership, coordination, policy influence, research and monitoring—not as an implementing department.[4] | High confidence on institutional role. Outcomes therefore depend on other departments and institutions accepting measurable ownership. |
This boundary matters. It would be premature to say that South Africa has published an empowerment scorecard; it has approved one and disclosed selected baseline findings. It would be equally wrong to dismiss the project as empty because the full method is not in the rollout statement. The unresolved question is whether the government will turn a Cabinet-level analytical product into a durable public accountability tool.
The gap is not a lack of statistics
South Africa already produces evidence that could constrain the index. Statistics South Africa's summary of Gender Series Volume XI reports that in the second quarter of 2024 the labour-force participation rate was 55.8% for women and 65.6% for men. The employment rate was 35.8% for women and 44.9% for men.[5] Those numbers fit Cabinet's warning that labour-market outcomes are a weak dimension, but they do not reveal which series, year or transformation the new index uses.
Other measures pull in different directions. UN Women's country data page displays women holding about 46% of national parliamentary seats, while women and girls aged 10 and older spend 15.6% of their time on unpaid care and domestic work, against 6.5% for men and boys.[6] The page also warns that gender-data coverage is incomplete and that the underlying indicators have different vintages.[6] Political representation, paid work and unpaid time can therefore move differently. A single composite score must not make one improvement erase another deficit.
Safety creates an even sharper test. AP's reporting ahead of the anniversary cites a UN Women-supported study's finding that more than one in three South African women had experienced physical or sexual violence in their lifetime. It also records women describing violence as a present constraint on movement and economic participation—the very freedoms the commemoration invokes.[2]
Cabinet's short index description does not say whether violence, safety, bodily autonomy or unpaid care are included as indicators.[3] That absence from a summary does not prove exclusion. It creates a methodology question that only publication can answer. If the scorecard omits them, government should explain why and maintain a linked dashboard that prevents improvements in representation from obscuring constraints on safety and time.
A headline score can conceal three different countries
The announced baseline already suggests a split result: stronger representation inside public decision-making, weaker access to work and resources.[3] That is analytically useful because it rejects the comforting assumption that visible leadership automatically diffuses through the economy.
But a national average can still conceal at least three divides.
First, geography. A labour-market result for the whole country can hide different conditions across provinces, cities and rural areas. The published method should show the smallest geographic unit supported by reliable samples and mark estimates that are too uncertain to compare.
Second, position. Counting women in a category is not the same as measuring authority within it. Representation in Parliament, senior management, firm ownership and high-skill work describe different forms of power. They should remain visible beneath any composite.
Third, lived constraint. Access to credit or employment can improve while unpaid care absorbs time, violence limits mobility, or healthcare remains difficult to reach. An index that treats those as separate dimensions can expose the tradeoff. An index that averages them invisibly can hide it.
The answer is not to abandon aggregation. A composite can give Cabinet and the public a stable annual signal. The answer is to publish both levels: the headline for attention, and the full indicator table for diagnosis.
The march is more than a metaphor for measurement
On August 9, 1956, more than 20,000 women of different races marched to the Union Buildings against the extension of pass laws to Black women.[1][2] The protest converted dispersed restrictions on movement into a collective demand addressed directly to state power. Its scale and multiracial organization made women impossible to treat as a peripheral constituency.
An index is not a modern substitute for that political act, and a spreadsheet cannot inherit the march's moral authority. The useful connection is narrower: both make a claim legible to institutions that might otherwise fragment responsibility. The protest named an injustice. A credible scorecard should name the present gaps, who can act on them and whether those actions worked.
That is why transparency is not a technical afterthought. The responsible department says its role is coordination and monitoring.[4] It cannot directly create every job, approve every loan, staff every clinic or control every private boardroom. Its leverage lies in defining a shared measure, requiring departments to respond to it and preserving a record the public can audit.
What should happen in 24 hours, 7 days and 30 days
These are accountability recommendations, not announced government deadlines.
Next 24 hours — label the status accurately. Officials and reporters should distinguish among an approved index, a completed internal baseline and a publicly released scorecard. If the numeric baseline and method already exist at a stable public URL, government should link them from the anniversary and Cabinet pages. If they do not, it should say when they will appear.
Next 7 days — publish the release contract. The department should name the scorecard owner, statistical partners, indicator cut-off date, update month and revision policy. It should also state which measures will be disaggregated by province, age, race, disability and urban or rural location, subject to sample quality and privacy.
Next 30 days — connect weak scores to decisions. The baseline should include a machine-readable table, a short method note and a map from each low indicator to the department or regulator able to act. The mapping matters most for the already identified weak areas: firm ownership, listed-company leadership, credit and high-skill employment.[3]
Three paths from an approved index
Base path — a transparent annual statistical product. Government releases numeric pillar and indicator scores, source vintages, weights and a reproducible method. Trigger: a stable baseline page and dated methodology. Result: the index becomes useful for year-on-year scrutiny, even before policy outcomes improve.
Stronger path — the scorecard changes budgets and delivery. Departments attach actions, spending lines and deadlines to weak indicators, while Parliament tests progress during oversight.[4] Trigger: the same indicator appears in a departmental plan, a budget commitment and the next annual score. Result: measurement becomes a coordination mechanism rather than a communications product.
Breakdown path — the headline moves but nobody can inspect why. Government announces an annual composite without its components, changes sources silently or celebrates a gain driven by one strong dimension while labour, safety or care burdens stagnate. Trigger: no indicator table, no revision log and no named owner for weak results. Result: the index becomes another anniversary claim that cannot discipline implementation.
These are conditional scenarios, not forecasts. Publication of the underlying baseline is the first branching point.
The public-release checklist
- Publish every indicator's definition, numerator, denominator, source year and update frequency.
- Show pillar scores and raw indicators alongside the composite; do not offer only a national rank or single number.
- Disclose weights, normalization rules, missing-data treatment and any back-series revisions.
- Keep representation, labour outcomes, access to resources, health, safety and unpaid care visible rather than allowing one to cancel another.[2][3][5][6]
- Assign a public owner and next decision date to each indicator Cabinet has identified as weak.[3][4]
- Archive every annual edition so a later methodology change does not rewrite the historical record.
This analysis should be revised if a full baseline and methodology were already publicly available at the cutoff but absent from the source set below, or as soon as the government releases them. A new anniversary speech could also add a deadline or alter the implementation path. Until then, the evidence supports a precise conclusion: South Africa has approved a promising annual scorecard and disclosed its broad diagnosis. The 70th-anniversary test is whether the public gets the ledger needed to hold that diagnosis to account.
Sources
- Government of South Africa, "2026 National Women's Day Celebration" media-accreditation notice (July 20, 2026) — anniversary date, venue, healthcare emphasis and event framing.
- Michelle Gumede, Associated Press, "70 years after South Africa's women challenged apartheid, some say their freedom isn't complete" (August 8, 2026) — current reporting, witness interviews and provenance for the article photograph.
- Government of South Africa, "Statement on the Cabinet meeting of 6 May 2026" (published May 7, 2026) — index approval, three-sphere design, baseline direction and identified weak indicators.
- Parliament of South Africa, Portfolio Committee report on the Department of Women, Youth and Persons with Disabilities' 2026/27 plan (June 17, 2026) — departmental role, baseline-scorecard purpose and annual-measurement commitment.
- Statistics South Africa, "Gender Gaps Persist in SA Labour and Leadership Roles" — official summary of Gender Series Volume XI, including 2014–2024 participation and employment measures by sex.
- UN Women Data Hub, "South Africa" country fact sheet — parliamentary representation, unpaid-care measures and gender-data gaps, with indicator-specific vintages.