As of 2026-10-27 00:34 UTC.
Europe's emissions-monitoring conference has reached a consequential part of its programme: putting the people who measure the atmosphere alongside those who compile national emissions accounts. The meeting is scheduled for October 26–30 at ESA's ESRIN centre in Frascati, Italy. Its agenda brings national inventory discussions, atmospheric modelling and measurement networks into the same week.[1]
The opportunity is substantial. Atmospheric estimates offer another way to assess emissions accounts.[3] This analysis argues that the useful test is how much a second estimate tells us once the two approaches' boundaries and shared assumptions are made explicit.
The comparison begins before the measurement
Three pieces of evidence establish the starting point:
- October 26–30, 2026: the organisers' programme includes national inventory compilers and a workshop on interpreting atmospheric inversions. This confirms the planned discussion; it does not establish a conference agreement or a corrected national total.[1]
- December 2021: an Eionet report already identified barriers to routine use of inverse modelling by inventory teams and recommended closer exchange with scientists. It provides a historical baseline for this week's institutional challenge.[6]
- February 2020: a European inventory study showed how uncertainty grows when emissions are assigned to individual locations. Its findings are specific to that inventory.[5]
National inventories assemble emissions from information about human activities. CAMS, the Copernicus Atmosphere Monitoring Service, describes its reported-emissions datasets as a consolidation of national inventories. Gathering and harmonising the underlying information takes time: these products typically lag by a couple of years.[2]
That delay creates an obvious appetite for another view. Atmospheric inversion supplies one by comparing measured gas concentrations with concentrations simulated by a model, then adjusting estimated exchanges between the surface and atmosphere to improve the fit.[3] The observations constrain an estimate of emissions; the model connects what was measured in the air to what happened at the surface.
Consider a hypothetical industrial district where afternoon measurements imply emissions above the inventory's estimate for those hours. The annual account has been allocated across locations and time to make that comparison possible. The study identifies both spatial and temporal allocation as sources of uncertainty.[5]
A good total can conceal a poor location
Ingrid Super and colleagues' 2020 study makes the scale problem concrete. For their selected European domain, they estimated uncertainty of about 1% in total CO₂ emissions. Assigning emissions to particular grid cells introduced uncertainties reaching 40% for some cells. Those figures describe a particular inventory analysis, rather than a general accuracy rating for carbon monitoring.[5]
The practical implication is straightforward: confidence in a large area's total does not automatically carry down to every neighbourhood within it. In the hypothetical district, an excessive local estimate could be offset by an underestimate elsewhere. Improving the map might leave the regional total unchanged.
Observation coverage adds another complication. CAMS describes satellites and instruments near the ground as complementary: satellites offer broad coverage and measurements through the atmospheric column, while in situ instruments provide highly accurate sampling of the lower atmosphere. The latter are unevenly distributed, with better coverage in more accessible and more developed regions.[4]
That difference matters when comparing countries. A dense measurement network can reveal discrepancies that a sparse one misses. My reading is that an assessment of the accounts should also explain where the observing system had a realistic chance of finding an error. A quiet result from a poorly observed region offers limited reassurance.
Agreement needs its own explanation
There is a subtler dependency inside the cross-check. As the Eionet report explains, inverse models constrain an existing estimate of emissions or surface exchanges until simulated concentrations agree with observations.[6] The starting estimate is part of the calculation.
My interpretation is that agreement between the final atmospheric estimate and an inventory becomes more persuasive when analysts show how much the observations changed that starting point. Reporting sensitivity to alternative assumptions would help a reader distinguish a strongly constrained result from one that remains dependent on its initial estimate.
The physical accounting also needs care. CAMS separately presents vegetation-related CO₂ exchanges and estimates associated with human activities. Plants absorb and release carbon, producing daily and seasonal changes in atmospheric concentrations.[3][4] A comparison with fossil-fuel accounts therefore needs to explain how those other exchanges were handled.
These are reasons to make the comparison explicit. They also explain why bringing inventory compilers and atmospheric scientists together has practical value: each group needs to understand the other's categories, uncertainties and working calendar.[6]
What would count as progress this week
For inventory teams, researchers and journalists following climate claims, the following are scenarios to assess, rather than announced conference outcomes:
- Base case: the meeting improves shared methods and working relationships. The confirming evidence would be published procedures or examples that align geography, reporting period and emissions categories.
- Upside: participants document a reproducible discrepancy, investigate its cause and show how it improves an inventory. That would demonstrate a complete path from observation to correction.
- Downside: comparisons circulate without sufficient information about coverage, uncertainty or starting assumptions. Their totals may be striking while their diagnostic value remains unclear.
Over the next 24 hours, the useful distinction is between what the programme promises and what speakers have actually demonstrated. Over seven days, look for accessible methods and conclusions following the scheduled October 30 close.[1] Over 30 days, a reasonable follow-up is whether a named inventory team has published a concrete next step. These are suggested review intervals, not organiser deadlines.
- Match the geographical boundary, period and emissions categories before comparing totals.
- Look for uncertainty estimates and evidence that observations materially constrain the result.
- Reassess this analysis if published results demonstrate a routine, reproducible correction process. A documented conference output could move the story beyond the implementation gap identified here.
Sources
- ESA, EEA, CAMS and EUMETSAT, Emissions Monitoring from Space and Ground Conference 2026 — official dates, venue, objectives and programme; accessed October 27, 2026.
- Copernicus Atmosphere Monitoring Service, “Reported anthropogenic emissions” — construction of inventory-based emissions products and their typical reporting lag.
- Copernicus Atmosphere Monitoring Service, “Monitoring fluxes and emissions” — atmospheric inversion, regional estimates and the distinction between vegetation exchanges and human activity.
- Copernicus Atmosphere Monitoring Service, “Observations of greenhouse gases” — complementary satellite and in situ measurements, uneven coverage and biological variability.
- Ingrid Super and colleagues, “Uncertainty analysis of a European high-resolution emission inventory of CO₂ and CO to support inverse modelling and network design,” Atmospheric Chemistry and Physics, February 14, 2020 — abstract and sections 1–2 on regional totals, spatial allocation and uncertainty.
- Richard German, Bradley Matthews and Paul Ruyssenaars, “Inverse modelling as a tool to support national greenhouse gas monitoring in Europe,” ETC/CME Report 4/2021, December 17, 2021 — Eionet summary of methods, adoption barriers and cooperation between scientists and inventory compilers.
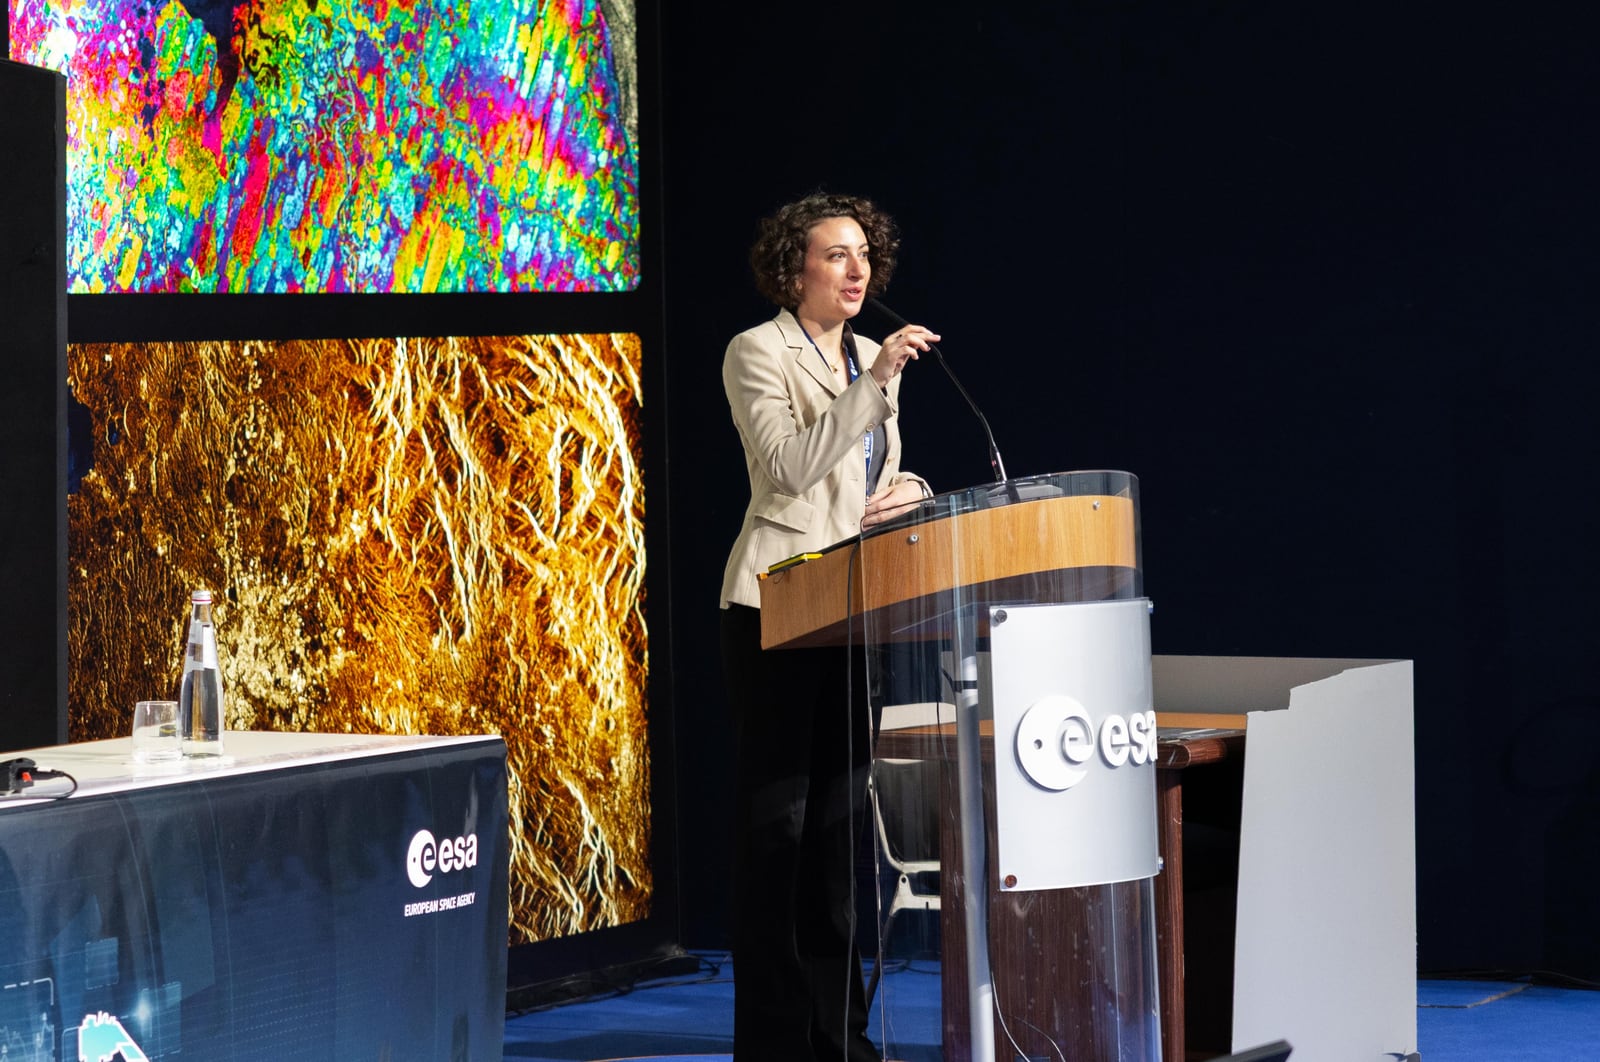
- European Space Agency, “StatEO26 hosted by ESA in Italy,” May 8, 2026 — photograph of an earlier conference at ESRIN connecting Earth observation and official statistics; reproduced at reduced resolution.