The storm did not stop at a border. During the night of 31 January–1 February 1953, wind drove a surge south through the North Sea just as a spring tide raised the baseline beneath it. Water overwhelmed defenses in the Netherlands, Belgium, Scotland, and eastern England. It killed 1,836 people in the Netherlands and 307 in eastern England, where about 24,000 properties flooded.[1][2][7]
The two largest national responses are often reduced to monuments: the Dutch built the Delta Works; the British built the Thames Barrier. That pairing is true but incomplete. It hides the more revealing contrast. The Netherlands used the catastrophe to reduce the length of coastline it had to defend and to concentrate responsibility for the most important barriers. Britain strengthened physical defenses too, but its distinctive reform connected national forecasting to a coast whose protection remained divided among many authorities. One country shortened the hydraulic frontier. The other tried to lengthen the time between forecast and doorstep.
This was not because Dutch engineers understood water while British officials understood communication. Forecasts existed in both countries, and both failed to become timely public action. Nor do the death tolls offer a fair national scorecard: terrain, settlement, building type, flood depth, and the sequence of local failures were not the same. The comparison instead asks a narrower question: how did one shared surge become two different safety systems?
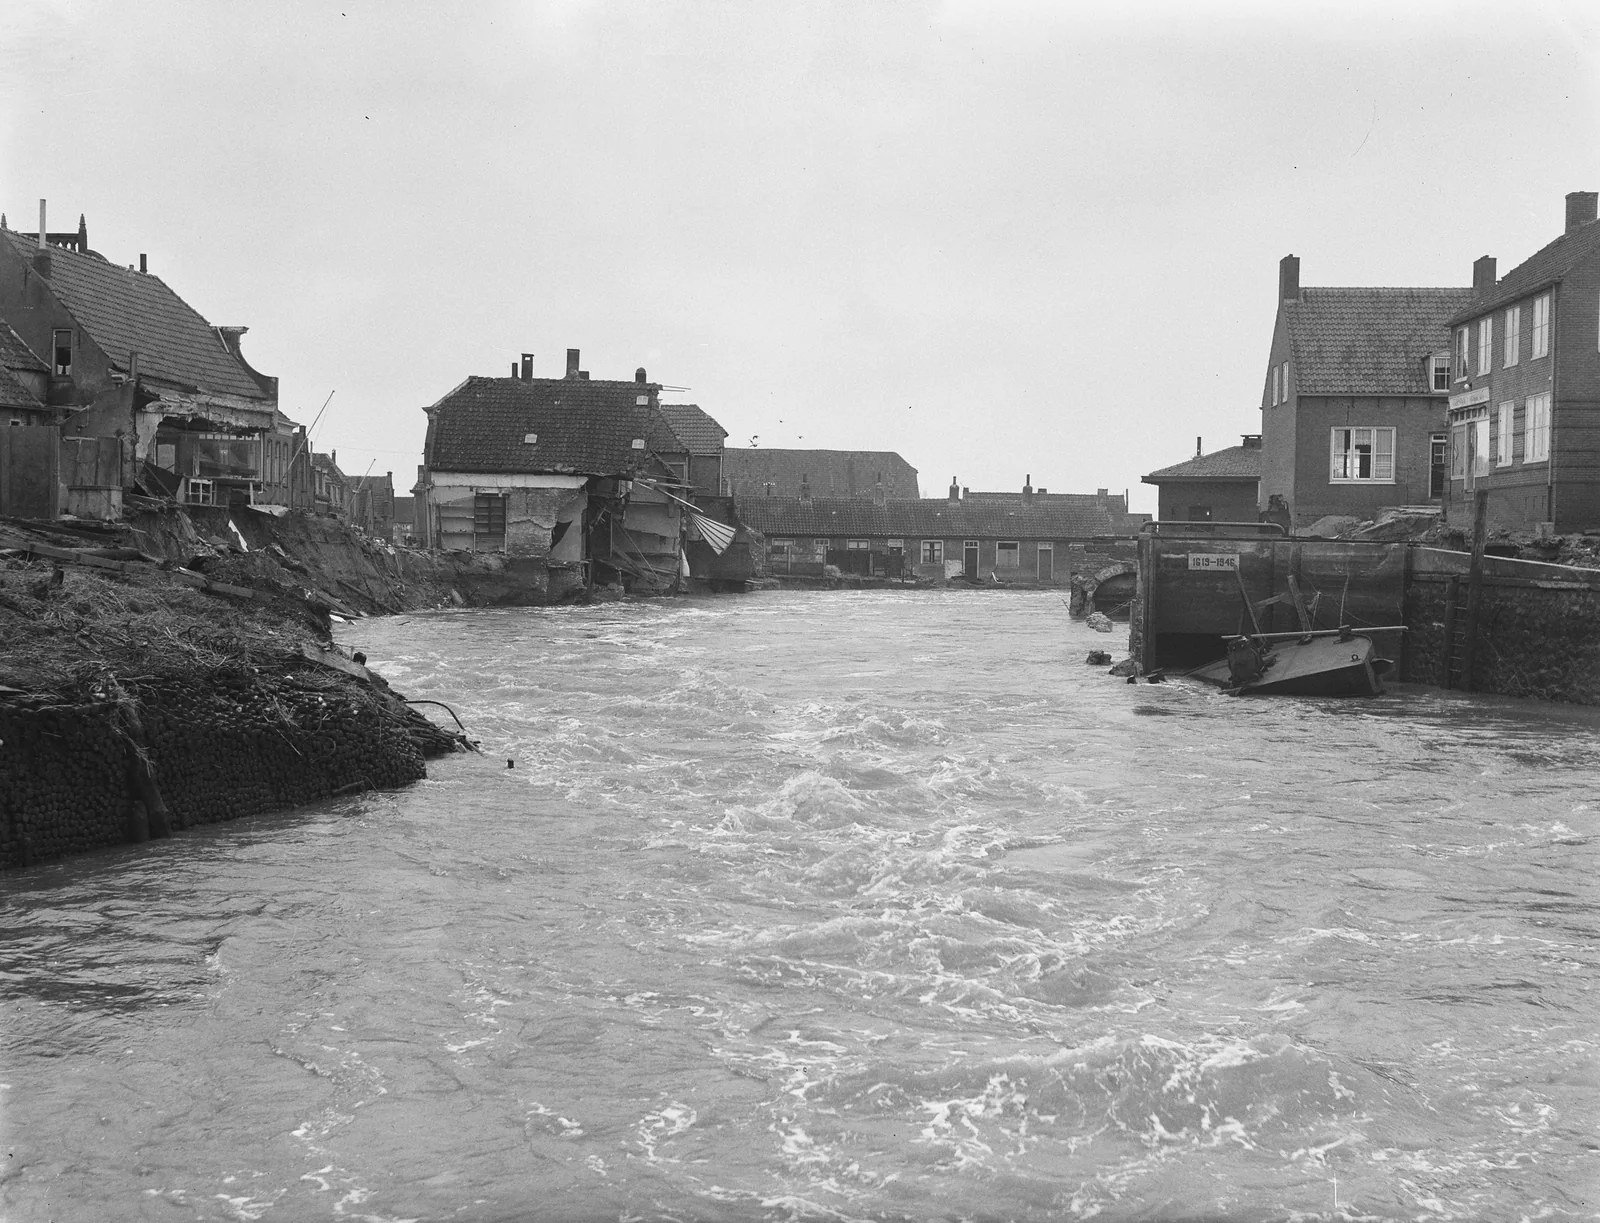
Image context: The cover is a real archival photograph made by van Duinen for Anefo on 13 February 1953, twelve days after the flood. Its glass negative belongs to the Dutch National Archives, and the digitized file is catalogued by Wikimedia Commons. The frame looks into floodwater rushing through the breach at Den Bommel, not a generic storm. It belongs here because the Dutch response began by treating every such opening as part of one long, vulnerable geometry.[9]
One sea, two kinds of exposure
The weather system was shared; the exposure was not. Herman Gerritsen’s retrospective for the Royal Society stresses the Netherlands’ low-lying southwestern geography. Generations of reclamation had created polders behind outer and inner dikes, many below sea level. When waves overtopped steep, weakened embankments, water saturated the landward face, eroded the toe, and could make the slope slide away. The failure of one line then exposed the next.[2]
Across the Dutch delta, the Watersnoodmuseum counts 96 large breaches and nearly 400 smaller ones. Water inundated roughly 200,000 hectares, destroyed 3,300 homes and farms, and damaged another 43,000.[4] Those figures describe more than a high tide. They describe a defensive system with hundreds of potential openings around estuaries, islands, and reclaimed land. Once seawater entered a low polder, gravity did not help it leave.
Britain’s eastern coast also suffered cascading local failures. The Met Office records about 160,000 acres flooded and identifies especially lethal inundations at Canvey Island and Jaywick.[1] Yet the British problem appeared as a long chain of exposed communities, sea walls, river boards, coast-protection authorities, and local emergency arrangements stretching from the Humber toward the Thames. The Dutch disaster made the sheer length and depth of the national water boundary look untenable. The English disaster made the gaps between forecast, authority, and local warning impossible to ignore.[3][6]
That distinction should not be pushed too far. Both countries needed stronger embankments, better measurements, and warnings that people could act on. But different landscapes and administrative traditions made different reforms look like the natural center of the answer.
A forecast is not yet a warning
The most important shared failure happened after meteorologists recognized danger. The Dutch Storm Tide Warning Service had operated since 1921. On 31 January 1953, it sent a first telegram at 11 a.m.; by 5:30 p.m., warnings for “dangerous high water” had gone to the Rotterdam, Willemstad, and Bergen op Zoom districts. Regular radio bulletins carried the warning, then Dutch broadcasting shut down at midnight as usual. Peak water arrived between roughly 3 and 4 a.m.[2]
The network behind those messages was startlingly thin. Gerritsen found only 30 subscribers to the telegram service. Of more than 200 water boards, just one—Walcheren—received the exceptional-water telegram, even though water boards were responsible for dikes. Telephones were not common in the islands, ferries had stopped for the night, and most residents and officials were asleep. The Netherlands possessed a forecast and a distribution procedure, but not a chain that could reliably wake threatened households and mobilize local defenses.[2]
Britain lacked even a national flood-warning organization. The Met Office says the surge itself was successfully predicted several hours in advance, but warnings and emergency plans were not connected along the coast. Alexander Hall’s comparative history notes that communities were inundated in succession as the surge moved south, yet many still met the water unexpectedly.[3][8]
The distinction matters. “No warning” can mean that nobody predicted the hazard, that a forecast did not reach the responsible authority, that an authority could not translate it into a local alarm, or that residents had no practiced action to take. In 1953, the break lay chiefly in the later links. More accurate meteorology alone would not have repaired them.
The Dutch answer: remove hundreds of edges
The Dutch government established a Delta Committee on 18 February 1953, less than three weeks after the flood. It inherited studies that predated the disaster and combined coastal engineering, hydrology, and economics. By May it had advised on closing the difficult breach at Schelphoek and protecting the Hollandse IJssel near Rotterdam. Its main advice of 27 February 1954 rejected the idea of merely raising every existing dike. Instead, it proposed closing the northern mouths of the southwestern delta with a more direct line between natural dunes.[2][4]
The logic was geometric before it was monumental. Rijkswaterstaat describes the completed system as reducing a twisting defensive coastline of about 700 kilometers to roughly 80. Dams turned some tidal inlets into controlled waters; movable barriers kept other channels open until a surge required closure. Fewer exposed kilometers meant fewer primary structures whose height, slope, maintenance, and local management all had to hold at once.[5]
Construction on the Hollandsche IJssel barrier began in January 1954, before the full Delta Plan entered its long legislative and building phase. The program was never a single frozen blueprint. In 1975, pressure from fishing, shellfish cultivation, and a stronger environmental movement led Parliament to replace the planned solid closure of the Oosterschelde with a vast movable barrier. When it opened in 1986, its gates preserved the basin’s tides under ordinary conditions while retaining the ability to close against a surge.[2]
That revision exposes what the phrase “the Dutch engineered their way out” leaves out. The Delta Works were an institutional choice about which waters would remain tidal, who would bear ecological and economic costs, and what probability of failure the state would accept. Concrete expressed the settlement; it did not create it by itself.
The British answer: add a national layer without erasing the local map
Britain’s Departmental Committee on Coastal Flooding, chaired by Viscount Waverley, reached a different settlement. When the government summarized its report in Parliament on 3 June 1954, it explicitly retained the existing distribution of responsibility among river boards, coast-protection authorities, and two ministries. It also retained a local contribution to the cost of sea defenses. Britain did not answer the flood by placing its entire exposed coast inside one new hydraulic authority.[6]
Instead, Waverley added standards and connections. The committee recommended defenses capable of withstanding the January 1953 flood where inundation threatened extensive valuable farmland, major industrial property, or compact residential areas. Elsewhere, it allowed lower standards. For London, it called for coordination along the tidal Thames and urgent study of a closable structure across the river rather than endlessly raising its banks.[6]
Most immediately, the committee’s interim work produced an East Coast flood-warning system for the winter of 1953–54. Research, tide gauges, surge models, forecast routines, and arrangements for alerting authorities gradually turned that emergency measure into a national service.[6][8] Physical construction remained essential: sea walls and embankments were strengthened, and the Thames Barrier became the most visible later result. But the warning service solved a different class of problem. It made a danger detected offshore capable of moving through institutions faster than the surge moved down the coast.
This is why “the Dutch built defenses while the British built warnings” would be false. Both did both. The sharper contrast is between the systems they made central. The Delta Plan redrew the interface between land and sea. Waverley largely preserved Britain’s fragmented coastal administration while adding national information, research, and coordination above it—and a movable barrier where the concentration of people and property in London justified one.[5][6][7]
December 2013 was a test, not a controlled experiment
On 5–6 December 2013, another major North Sea surge struck Britain. Its storm track, waves, astronomical tide, and geographic footprint differed from 1953, so it cannot serve as a laboratory replay. Even so, researchers found a useful historical contrast. The later event flooded about 2,800 properties, compared with about 24,000 in 1953, despite producing extreme sea levels around a wider portion of Britain. There were no flood-related deaths.[7][8]
No single intervention deserves that result. Stronger defenses held in many places; barriers could be closed; a denser gauge network fed better surge models; forecasters identified the possibility more than five days ahead and increased confidence three days ahead; emergency services then had time to prepare and residents could be warned.[7][8] The achievement was not prediction in isolation. It was a chain of observation, modeling, decision, infrastructure, communication, and practiced response.
The Dutch system carries the same composite lesson. A shorter defensive line still depends on inspection, institutions, forecasts, gates, and people who know when to move them. The photograph of Den Bommel makes that dependency visible. A dike is not simply present or absent. It is designed, maintained, watched, warned, repaired, and eventually reconsidered.
Two ways to turn water into time
The North Sea flood did not hand either country a ready-made lesson. The Netherlands selected one from its delta geography and its capacity for national water planning: reduce the number of exposed edges, set demanding safety standards, and make a long construction program politically durable. Britain selected one from a distributed administrative coast: keep much of the local map, but build a national layer that could see the surge, interpret it, and start action before water arrived.
Both strategies converted space into time. Closing estuaries gave Dutch communities fewer lines to defend and more controllable barriers. Forecasting and warning gave British communities hours—and, with later science, days—in which defenses and people could move. Neither abolished risk. Their real historical achievement was to stop treating a forecast, a dike, or a ministry as a complete safety system on its own.
Sources
- Met Office, East Coast Floods, 31 January 1953 — official historical factsheet on the storm sequence, English death toll, flooded area, and hardest-hit communities.
- Herman Gerritsen, “What Happened in 1953? The Big Flood in the Netherlands in Retrospect,” Philosophical Transactions of the Royal Society A 363 (2005) — peer-reviewed reconstruction of Dutch geography, dike failures, warning distribution, Delta Committee reasoning, and later design changes.
- Alexander Hall, “The North Sea Flood of 1953,” Environment & Society Portal (2013) — comparative environmental history of British and Dutch warning failures, impacts, and post-flood reforms.
- Watersnoodmuseum, “The History of the Delta Works” — institutional account of the Dutch breach count, damage, Delta Committee appointment, and first projects.
- Rijkswaterstaat, “De Deltawerken” — Dutch water authority account of the program’s construction and the reduction of the defended coastline from about 700 to 80 kilometers.
- UK Parliament, “Coastal Flooding (Committee’s Report),” House of Commons written answer, 3 June 1954 — contemporary summary of the Waverley Committee’s recommendations on responsibility, defense standards, warning, research, and a Thames barrier.
- Matthew Wadey et al., “A Comparison of the 31 January–1 February 1953 and 5–6 December 2013 Coastal Flood Events around the UK,” Frontiers in Marine Science 2 (2015) — open research record and paper on storm differences, property impacts, forecasting, warnings, and defense upgrades.
- Met Office, “Floods and Flooding” — official case study on successful 1953 forecasts, creation of the Storm Tide Warning Service, and the forecast-to-response chain in December 2013.
- Wikimedia Commons, “Dijkdoorbraak bij Den Bommel, Bestanddeelnr 905-5475” — source page for van Duinen’s 13 February 1953 archival photograph from the Dutch National Archives used as the article image.