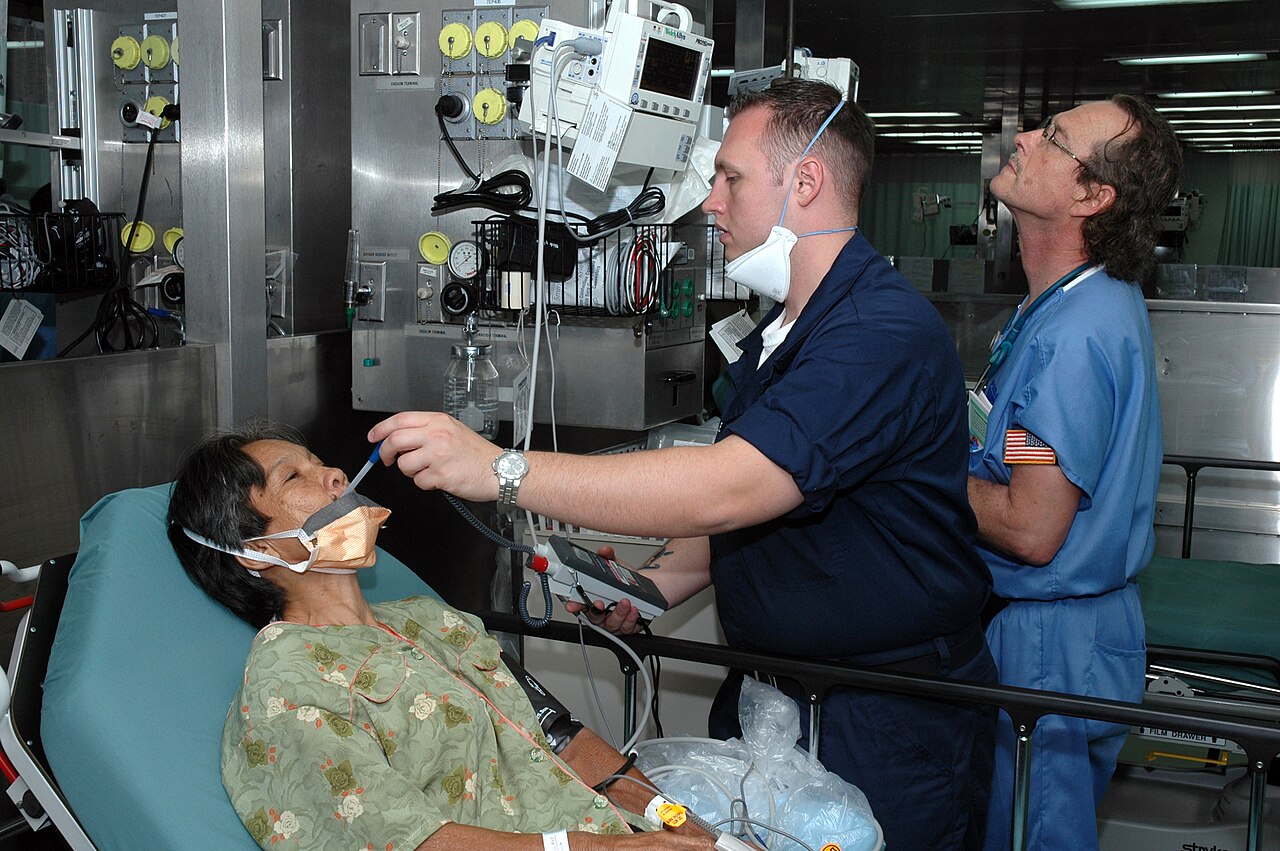
In a 2006 photograph from the hospital ship USNS Mercy, a corpsman holds a thermometer at a patient's mouth while a nurse watches the rest of the bedside information. Stainless steel, cables, a blood-pressure gauge, a monitor and handwritten records crowd the frame. Temperature is one observation among several, taken by one person and interpreted by a team.[6]
That scene is a better monument to Carl Reinhold August Wunderlich than the number usually attached to his name. The German physician is remembered for fixing “normal” human temperature at 37°C, or 98.6°F. Yet his much more interesting contribution was to codify and popularize temperature as a serial record: measure it at a stated body site, note the time, repeat the procedure, record the result, and read the changing line alongside the patient's condition.[1]
W. Bathurst Woodman's 1871 English translation of the second German edition of Wunderlich's On the Temperature in Diseases—the first German edition appeared in 1868, and the second in 1870—is therefore worth opening rather than merely citing. Its hundreds of pages do not worship one decimal point. They codify a system for turning bodily heat into a clinical course—and repeatedly warn that a degree without method or interpretation is weak evidence.[1]
Image context: the cover photograph shows thermometry after that system became ordinary. The instrument is faster and the setting is far from nineteenth-century Leipzig, but temperature is still collected as part of a record rather than treated as a diagnosis by itself.[6]
The preface promises a course, not a cutoff
Wunderlich announces that he has written a practical book. His subject is the “course of the temperature in disease”: the way repeated readings might reveal a regular pattern, an unexpected deviation, a relapse, an improvement, or the effect of treatment before those changes become otherwise obvious.[1]
The word course does the intellectual work. A single measurement sorts a patient into warmer or cooler at one moment. A sequence can show direction, timing and shape. In Wunderlich's framework, morning remission and evening rise, the height and duration of a plateau, and the speed of a fall all become observations that can be compared with the expected progress of an illness.[1]
This was an ambitious claim, and the book's disease-specific curves belong to its time. This close reading does not treat those nineteenth-century patterns as present-day diagnostic rules. The manual's underlying move remains familiar: a vital sign gains meaning through a baseline, a protocol and a trend.
Wunderlich also sets a boundary that popular retellings tend to erase. A normal reading cannot prove health, he says, and a temperature should not produce a positive diagnosis by itself. Later, in his chapter on who should collect observations, he makes the point sharper: “The mere reading of thermometer degrees helps diagnosis no more than dispensing does therapeusis.”[1] Collection can be delegated. Interpretation cannot be reduced to transcription.
A curve begins with where and when
The manual's most revealing pages concern ordinary technique. Wunderlich preferred the closed axilla for most measurements because it was convenient, did not exhaust the patient and avoided objections of propriety. Convenience did not make the site neutral. He noted that axillary readings ran below readings from the rectum or vagina, that a thin or restless patient could make the result uncertain, and that inspired air could disturb an oral measurement.[1]
The old mercury instrument also demanded time. Wunderlich instructed the observer to dry perspiration, place the bulb deep in the armpit, press the arm against the chest and wait for the column to settle. He wrote that this often took 10 to 15 minutes and could take 20 minutes or longer. A hurried reading was not simply less precise; it could be a different measurement because the newly closed axilla was still warming around the glass.[1][2]
Time of day belonged in the protocol too. For routine clinical purposes, the book proposed observations around 7–9 a.m., near the daily low, and 4–6 p.m., near the daily high. Important or rapidly changing cases might require readings every two to four hours, or even more often. The observer was to record the date, clock time, duration and relevant circumstances rather than leave behind a naked number.[1]
This attention to procedure explains why a thermometer is not a tiny truth machine. It senses temperature at a particular interface under particular conditions. The U.S. Food and Drug Administration makes the same point for modern non-contact infrared thermometers: the environment, distance, position and condition of the forehead can all affect a reading, so the device's instructions are part of the measurement.[5] Technology shortened the wait; it did not abolish method.
How 98.6°F escaped from the book
The 1871 English translation does print 98.6°F. It renders Wunderlich's 37°C as the average healthy temperature in a well-closed axilla and says internal sites generally read a few tenths of a degree higher. But the same opening chapter acknowledges spontaneous variation over 24 hours. Later chapters describe a healthy axillary range, daily fluctuation and differences among measurement sites.[1]
The famous constant is therefore both present and misleading. The translator's exact Fahrenheit conversion of the rounded 37°C produced 98.6°F, a more precise-looking answer that fits on a scale, a chart and a memory. The qualifiers—axilla, equilibrium time, hour of day, individual course—travel less easily.
In 1992, Philip Mackowiak, Steven Wasserman and Myron Levine tested several of Wunderlich's propositions with 700 electronic oral-temperature readings from 148 healthy adults aged 18–40. Their overall mean was 36.8°C (98.2°F), and exactly 37°C accounted for only 56 readings, or 8% of the total. They found a 6 a.m. low, a 4–6 p.m. high and a mean daily swing of about 0.5°C.[2]
Those results challenged 37°C as a universal normal value while preserving the more important temporal insight. They also did not reproduce Wunderlich's experiment exactly. Mackowiak's team measured orally with electronic devices; Wunderlich usually measured in the axilla with slow mercury thermometers. A difference between the studies is evidence against a context-free constant, not proof that one investigator simply knew how to read a thermometer and the other did not.[1][2]
Modern evidence replaces the point with a distribution
A 2019 systematic review makes the problem of one-number normality visible at larger scale. It combined 36 prospective studies, 7,636 healthy adults and 9,227 measurement sites. Across all sites the calculated mean was 36.59°C, but the ranges differed by site, and adults aged 60 or older averaged 0.23°C lower than younger adults. The authors' practical conclusion was not to crown a better magic number. It was that age and measurement site materially shape the reference range.[3]
An even larger historical analysis complicates the story further. In 2020, Myroslava Protsiv and colleagues examined 677,423 temperature measurements across three U.S. cohorts spanning 157 years of measurement. After adjustment, average temperature declined by roughly 0.03°C per birth decade. Because a similar decline appeared within the oldest cohort as well as between cohorts, the authors argued that changing instruments alone were unlikely to explain the pattern. They proposed lower chronic inflammation and changes in living conditions and metabolism as plausible contributors, while acknowledging that observational data cannot isolate one mechanism.[4]
This does not mean every person's temperature has steadily fallen on a historical schedule. The cohorts differed, the measurements were collected for different purposes, and several potentially relevant variables were missing. It means that “normal” is partly a population estimate, and populations, practices and instruments can change. A reference value is not a law of nature merely because the conversion gives it a decimal.[3][4]
The curve is the durable legacy
Wunderlich's manual succeeds best when it argues against the simplified Wunderlich legend. He wanted comparable observations, but he did not imagine comparability arose from the glass alone. The observer had to standardize the site, allow enough time, repeat readings at meaningful hours and preserve the circumstances. Only then could a clinician ask whether the line followed an expected course or broke away from it.[1]
That logic also clarifies the modern boundary. A clinical threshold can be useful for screening or action without defining every healthy person. A fast thermometer can be useful without making every body site interchangeable. A trend can add information without diagnosing a disease on its own. The number is evidence; the protocol determines what kind of evidence it is.
Return to the Mercy photograph. The corpsman has the device, but the nurse has the surrounding record, and the patient has a body whose condition cannot be compressed into the display.[6] Wunderlich's lasting contribution sits in that relationship. He did not merely give medicine 98.6°F. He helped teach the bedside to ask where a number came from, when it was taken, what came before it, and where it moved next.
Sources
- Carl Reinhold August Wunderlich, On the Temperature in Diseases: A Manual of Medical Thermometry, translated by W. Bathurst Woodman from the second German edition (New Sydenham Society, 1871) — digitized primary source used for the preface, measurement protocol, normal-range claims and emphasis on serial observation.
- Philip A. Mackowiak, Steven S. Wasserman and Myron M. Levine, “A Critical Appraisal of 98.6°F, the Upper Limit of the Normal Body Temperature, and Other Legacies of Carl Reinhold August Wunderlich,” JAMA 268(12), 1992 — 700 oral readings from 148 healthy adults.
- Ivayla I. Geneva et al., “Normal Body Temperature: A Systematic Review,” Open Forum Infectious Diseases 6(4), 2019 — pooled evidence on measurement site, age and normal-temperature ranges.
- Myroslava Protsiv et al., “Decreasing Human Body Temperature in the United States Since the Industrial Revolution,” eLife 9, 2020 — analysis of 677,423 readings across three historical cohorts.
- U.S. Food and Drug Administration, “Non-contact Infrared Thermometers” — official guidance on environmental conditions, positioning and technique as parts of temperature measurement.
- Photographer's Mate 1st Class Michael R. McCormick, “Navy Hospital Corpsman John Hensley Takes a Patient's Temperature” (U.S. Navy photograph, May 29, 2006), Wikimedia Commons — source page and provenance for the article image.