A PET appointment contains a stretch of apparently uneventful time. After the tracer injection, a patient usually rests while the substance circulates and accumulates in tissue; the scan comes later. That interval is already part of the measurement. The body is distributing the material whose radioactive signals will become the picture.[1]
Positron emission tomography follows an unusual chain: an atom decays, a positron encounters an electron, and detectors register the resulting photons. The image maps tracer activity; understanding why a region is active requires additional evidence.[2][8]
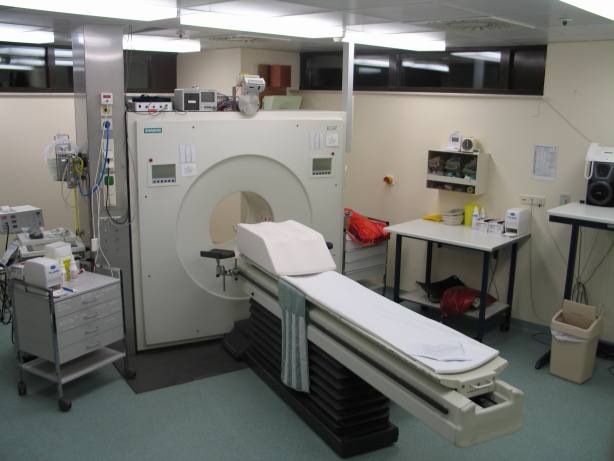
The chemistry chooses what becomes visible
One widely used tracer is fluorodeoxyglucose, or FDG, labelled with radioactive fluorine-18. FDG resembles glucose closely enough to enter cells through glucose transporters and participate in the first step of glucose metabolism. Its subsequent retention gives the scanner time to detect where it has accumulated.[4][5]
Brookhaven National Laboratory's team synthesized fluorine-18-labelled FDG in 1976. Its usefulness extends beyond cancer. In a 2013 experiment described by the laboratory, researchers stimulated selected brain cells in awake rats and used FDG to trace the resulting pattern of brain activity. The tracer remained detectable after the animals were anesthetized for scanning. That experiment makes an essential point concrete: the image can preserve information about activity during uptake, before the subject enters the scanner.[4]
The radioactive label supplies a detectable signal; the carrier molecule helps determine its location. Different PET tracers can investigate different biological processes through the same detection principle.[2]
Two arrivals make a line
Fluorine-18 has a physical half-life of about 110 minutes. As its nuclei decay, they can emit positrons, particles with the electron's mass and the opposite electric charge. An emitted positron encounters an electron in surrounding tissue; their annihilation produces the photon pair used in PET imaging.[2][5]
The two photons travel in approximately opposite directions, each carrying 511 kiloelectronvolts of energy. Detectors around the patient record their arrival. When two detections occur within a very short time window, the electronics can treat them as a possible pair from the same event. This is coincidence detection.[2][6]
The pair defines a line between the detection positions. It constrains where the annihilation happened without, by itself, identifying an exact point along that line. Reconstruction combines many such observations into an estimate of tracer distribution. The visible image emerges from accumulated evidence about locations.[6]
Some apparent pairs mislead. A photon may scatter inside the body and arrive from a changed direction; two unrelated photons may also happen to reach detectors close together in time. Energy measurements help distinguish scattered photons, while timing performance helps limit accidental coincidences. These details affect how faithfully a patch of apparent activity represents the tracer inside the patient.[6]
Giving activity an anatomical address
PET supplies a functional map, but assigning an active focus to a particular organ can be difficult. In their 2000 report on a combined PET/CT scanner, Thomas Beyer and colleagues described this problem especially clearly in the abdomen, where PET alone offered insufficient anatomical detail for precise localization.[7]
Their instrument acquired PET and CT during one session with a shared patient support. Keeping the patient on the same bed helped align the two sets of images. Matching scans acquired separately had been harder because internal organs could move between examinations. The combination put tissue activity and anatomical structure into a common frame of reference.[7]
CT also contributed to correcting the PET measurement for photons lost or scattered on their passage through the body. Thus, the added scan served both interpretation and reconstruction. It helped answer where the activity was and helped calculate the activity more accurately.[7]
A bright focus still needs a cause
Many cancers take up substantial FDG, which makes it valuable for investigating disease and response to treatment. But increased uptake can also accompany infection or inflammation. The same broad sensitivity that makes FDG useful creates an interpretive boundary: accumulation alone does not identify malignant cells.[1][8]
The EANM/SNMMI guideline on infection and inflammation makes this especially tangible. FDG is deliberately used to investigate selected inflammatory and infectious conditions. The document also describes ordinary distribution patterns, including activity in the urinary tract as the tracer is excreted and variable muscle uptake influenced by recent activity. Location, pattern and surrounding tissue matter alongside intensity.[8]
A reassuring-looking region has limits too. Small abnormalities can be difficult to characterize, and blood glucose or insulin conditions can affect the examination. Preparation instructions and the clinical question belong to the interpretation of the image. They help establish what the test could reasonably show in that particular examination.[1]
Keeping the interval comparable
This is why timing is documented rather than left as an administrative detail. The EANM's 2015 tumour-imaging guideline recommended an uptake interval of approximately 60 minutes and emphasized matching that interval in repeat examinations. It also called for consistent acquisition and reconstruction settings when following the same patient.[5]
A later scan may look different because tissue activity or measurement conditions have changed. Controlling the procedure makes the biological explanation more credible.[5] The quiet wait after injection, the detector timing and the clinical reading each contribute information that the finished image alone cannot explain.
Sources
- Radiological Society of North America and American College of Radiology, “PET/CT – Positron Emission Tomography/Computed Tomography,” RadiologyInfo, reviewed 15 June 2026 — examination sequence, uses and limitations.
- National Institute of Biomedical Imaging and Bioengineering, “Nuclear Medicine” — tracer selection, positron annihilation and photon detection.
- Jens Maus, “ECAT-Exact-HR--PET-Scanner.jpg,” April 2003, Wikimedia Commons — original photograph, scanner identification and public-domain provenance.
- Brookhaven National Laboratory, “Lights, Chemistry, Action: New Method for Mapping Brain Activity,” 10 April 2013 — FDG retention, the rat experiment and the laboratory's 1976 radiotracer work.
- Ronald Boellaard and colleagues, “FDG PET/CT: EANM procedure guidelines for tumour imaging: version 2.0,” European Journal of Nuclear Medicine and Molecular Imaging 42 (2015), 328–354 — tracer properties and measurement standardization.
- Deutsches Elektronen-Synchrotron, “Brief introduction to Positron Emission Tomography” — coincidence detection, lines of response, scattering and timing.
- Thomas Beyer and colleagues, “A Combined PET/CT Scanner for Clinical Oncology,” Journal of Nuclear Medicine 41 (2000), 1369–1379 — original scanner report, image alignment and CT-based corrections.
- EANM/SNMMI, “Guideline/procedure standard for [18F]FDG hybrid PET use in infection and inflammation in adults v2.0,” published online in 2024 — non-malignant uptake, physiological distribution and interpretation.