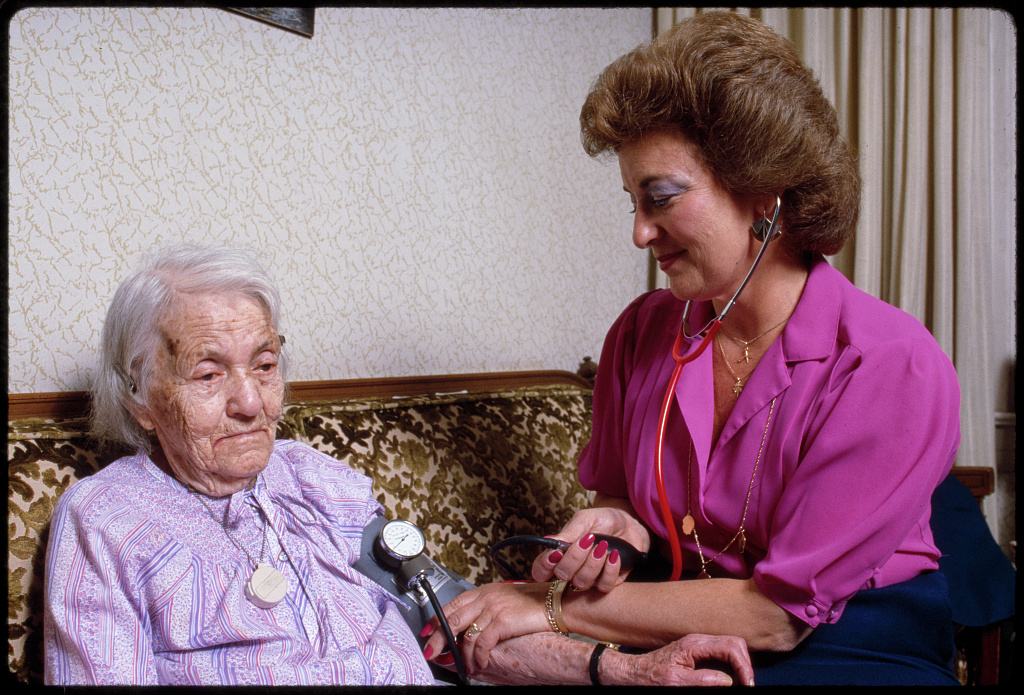
The photograph contains everything clinical medicine knows how to bring into focus: one woman, one cuff, one clinician, one reading. The patient's sleeve is gathered above the cuff. The instrument is close enough to touch. Whatever happens next can be tailored to the person on the sofa.[6]
Geoffrey Rose did not think that question was too small. He thought it was only one of two questions.
On 27 August 1984, at an epidemiology meeting in Vancouver, Rose began with a prompt he attributed to physician Roy Acheson: “Why did this patient get this disease at this time?” His paper, published in March 1985 as “Sick Individuals and Sick Populations,” then changed the unit of attention. Why, he asked, does one population have much more disease than another? The first question searches for differences between people. The second searches for whatever moved the rate for the group.[1]
That distinction is the paper's durable achievement. It explains how research can become very good at identifying vulnerable individuals while remaining oddly incurious about the conditions that keep producing them. It also explains why prevention cannot be reduced to finding the right people and giving them better advice.
Two causal questions, not two kinds of patient
Rose's opening thought experiment is brutally simple. Imagine a population in which everyone smokes the same amount. A case-control study comparing people with and without lung cancer would not identify smoking, because smoking does not vary inside the population. The study might instead find traits that distinguish the people who became ill from those who did not: genes, prior disease, or some other marker of susceptibility.[1]
Those traits could genuinely help explain who developed cancer. They would still fail to explain why lung cancer was common there. To see the shared exposure, a researcher would need another population with less smoking, or the same population before or after smoking changed.
This is not an attack on case-control or cohort research. It is a warning about what any comparison can see. A factor that is nearly universal within the study group has little power to explain variation within that group, even if it powerfully explains the group's disease burden. Conversely, a marker that separates cases from non-cases may be useful for prediction without being the force that made the disease common.
Rose called these the causes of cases and the causes of incidence. The phrases sound like a semantic distinction; they are actually instructions for choosing evidence. The first problem requires contrasts among individuals. The second often requires contrasts among places, institutions, or periods of time. Confusing them can turn “normal for this population” into “healthy,” or turn a predictor of vulnerability into a complete causal story.[1]
The paper's distributions are arguments, not diagnoses
Rose built his case from population distributions. One comparison set blood-pressure measurements from middle-aged Kenyan nomads beside those from London civil servants. Another set cholesterol distributions from East Finland and Japan side by side. Within each population, people varied. Between populations, the whole centre of the distribution sat somewhere else.[1]
The specific comparisons belong to the epidemiology of their era. They do not, by themselves, prove which diet, environment, social structure, or measurement choice moved each curve. Cross-population comparisons can be confounded, and the labels used for communities in older studies can flatten large differences inside them. A close reading should not promote Rose's illustrations into timeless clinical estimates.
Their methodological point survives. If the entire distribution shifts, explaining only the people at its extreme cannot explain the shift. The relevant evidence must ask what changed for many people at once: food supply, work, housing, pollution, prices, law, infectious exposure, care access, or social norms. An individual body is where illness occurs, but the exposure pattern may be organized elsewhere.[1]
Later scholarship has also tightened the claim. A population does not necessarily move as one neat curve. In 2016, Fahad Razak, George Davey Smith, and S. V. Subramanian showed why tracking only an average can mislead: body-mass-index distributions may widen rather than shift uniformly, leaving different parts of the population on different trajectories.[3] Rose's question therefore needs two follow-ups: did the centre move, and what happened to the spread and the tails?
Why the high-risk strategy remains necessary
The paper is sometimes remembered as a manifesto for mass prevention. It is more careful than that. Rose gave the high-risk approach a full defence before naming its limits.
Targeting people at greatest risk makes clinical and ethical sense. The likely benefit is larger, so an intervention's inconvenience or adverse effects may be more justifiable. Patients and clinicians have a concrete reason to act. Scarce time can go where the immediate need is greatest. The woman in the photograph is not an abstraction to be dissolved into a curve; she is exactly the person medicine owes an individual assessment.[1][6]
Rose drew on his own heart-disease prevention work to show that advantage. About 20,000 male civil servants were screened, and roughly 1,500 smokers with additional markers of cardiorespiratory risk were selected. The men had a specific reason to take cessation counselling seriously. In a separate five-year table, the 15% of men identified by risk factors accounted for 32% of myocardial infarctions; their observed incidence was 7%, against 4% among all men. A still smaller 2% with both ischaemic signs and risk factors had an incidence of 22%.[1]
Those historical figures are not current screening thresholds or treatment guidance. They show the logic of concentration: risk stratification can find a group in which help has a more favourable balance and events are more frequent.
But the same numbers show the ceiling. Most infarctions still arose outside the risk-factor group. Screening also creates borderlines, false reassurance, repeated testing, and a permanent queue of newly identified susceptible people. If the exposure that generates risk remains in place, the high-risk programme must keep finding and protecting the next cohort. It treats vulnerability without necessarily reducing its supply.
The prevention paradox is arithmetic before it is policy
Rose's prevention paradox begins with an unfriendly fact: a very large group at modest risk can produce more cases than a small group at extreme risk. A preventive change spread across the large group may therefore avert many events in total while offering only a small expected benefit to each participant.[1]
His historical calculation from Framingham data made the scale vivid. Moving the population blood-pressure distribution downward by 10 mm Hg, he estimated, could correspond to about a 30% reduction in attributable mortality. That was a model-based illustration from the evidence available in 1985, not a promise that any intervention producing that numerical change would be safe or achieve that outcome today.[1]
The distinction matters because “shift the population” is not a treatment. Removing lead from fuel, changing a food formulation, reducing smoke exposure, improving sanitation, offering a vaccine, prescribing a drug, and asking millions of people to sustain a new habit all have different mechanisms and risk profiles. Rose was especially cautious when a small individual benefit was pursued by adding an intervention with even a rare harm. The wider the exposure to prevention, the stronger the evidence for safety must be.[1]
The paradox also predicts a political problem. Successful prevention is recorded as an event that did not happen, dispersed across people who may never know they benefited. Individual rescue is visible; a shifted rate is not. That asymmetry helps explain why health systems repeatedly fund the cuff and the prescription more readily than the conditions that determine how many cuffs will be needed.
The strongest objection is hidden inside the average
Rose argued that changing shared conditions could be more behaviourally natural than repeatedly asking high-risk people to resist the world around them. If a safer default becomes ordinary, people no longer need exceptional motivation to choose it. A 2006 review by Yvonne Doyle, Alison Furey, and John Flowers found the paper still useful for exactly that reason, while insisting that population and individual approaches were complementary rather than rivals.[2]
Yet “population-wide” does not mean “equally received.” Katherine Frohlich and Louise Potvin's 2008 inequality critique showed how a universal intervention can widen health gaps when people have unequal money, time, literacy, transport, safety, or power to convert the offer into benefit. An information campaign technically reaches everyone; the people best equipped to act may improve first. Average health can rise while relative or absolute inequalities worsen.[4]
This produces two serious readings of Rose. One says his framework already points upstream: change environments and institutions, keep high-risk care, and stop treating personal susceptibility as the whole explanation. The other says a single population distribution can hide socially distinct groups, and a policy designed for the average may reproduce the very conditions it claims to remove. The two readings are not mutually exclusive.
A later synthesis is often called proportionate universalism: establish a universal floor, then increase the scale or intensity of support with disadvantage. The International Agency for Research on Cancer's 2019 review of prevention and inequality describes this as a way to combine population reach with a vulnerable-group approach, while warning that results depend on the intervention and on how inequality is measured.[5]
What would settle an argument about a particular policy is not its label. The evidence would need to show the exposure distribution before and after; uptake and outcomes across relevant social groups; absolute as well as relative changes; adverse effects; and what happened to people already at high risk. A falling average with a widening tail is a different success from a distribution that narrows as it moves.
Read the photograph one more time
Bernard Gotfryd's photograph belongs to the Library of Congress. It preserves a real clinical encounter, not a symbol assembled from floating medical icons. Its strength is also its boundary: the frame can show the cuff, the patient, the clinician's hands, and the apparatus, but not the food system, workplace, neighbourhood, income, law, or air outside the room.[6]
Rose's paper teaches a disciplined way to look beyond that frame without looking past the patient. Ask who needs protection now. Then ask why this need is common here, in this group, at this time. The first question directs care toward a person. The second tests whether society is manufacturing the risk that care must repeatedly manage.
That is why the paper remains sharper than the slogan attached to it. It did not prove that population policies always beat targeted medicine. It showed that a perfect account of individual susceptibility can still leave the incidence rate unexplained—and that prevention is incomplete until it asks both questions.
Sources
- Geoffrey Rose, “Sick Individuals and Sick Populations,” International Journal of Epidemiology 14, no. 1 (1985), 32–38 — archived full-text reprint of the primary source for its two causal questions, historical examples, strategy comparison, and numeric illustrations.
- Yvonne G. Doyle, Alison Furey, and John Flowers, “Sick individuals and sick populations: 20 years later,” Journal of Epidemiology and Community Health 60 (2006), 396–398 — reassessment arguing that individual and population strategies remain distinct and complementary.
- Fahad Razak, George Davey Smith, and S. V. Subramanian, “The idea of uniform change: is it time to revisit a central tenet of Rose's ‘Strategy of Preventive Medicine’?” American Journal of Clinical Nutrition 104 (2016), 1497–1507 — critique of mean-only population thinking using changes in BMI distributions.
- Katherine L. Frohlich and Louise Potvin, “The Inequality Paradox: The Population Approach and Vulnerable Populations,” American Journal of Public Health 98 (2008), 216–221 — full-text record on how population interventions can distribute benefits unequally and why vulnerable-group strategies may be needed.
- Gwenn Menvielle, Ivana Kulhánová, and Johan P. Mackenbach, “Assessing the impact of a public health intervention to reduce social inequalities in cancer,” in IARC Scientific Publication No. 168 (2019) — review of absolute and relative inequality measures and proportionate universalism.
- Library of Congress, “Elderly woman receiving a blood pressure test,” Bernard Gotfryd photograph, reproduction no. LC-DIG-gtfy-06776 — catalogue and download record for the article image.