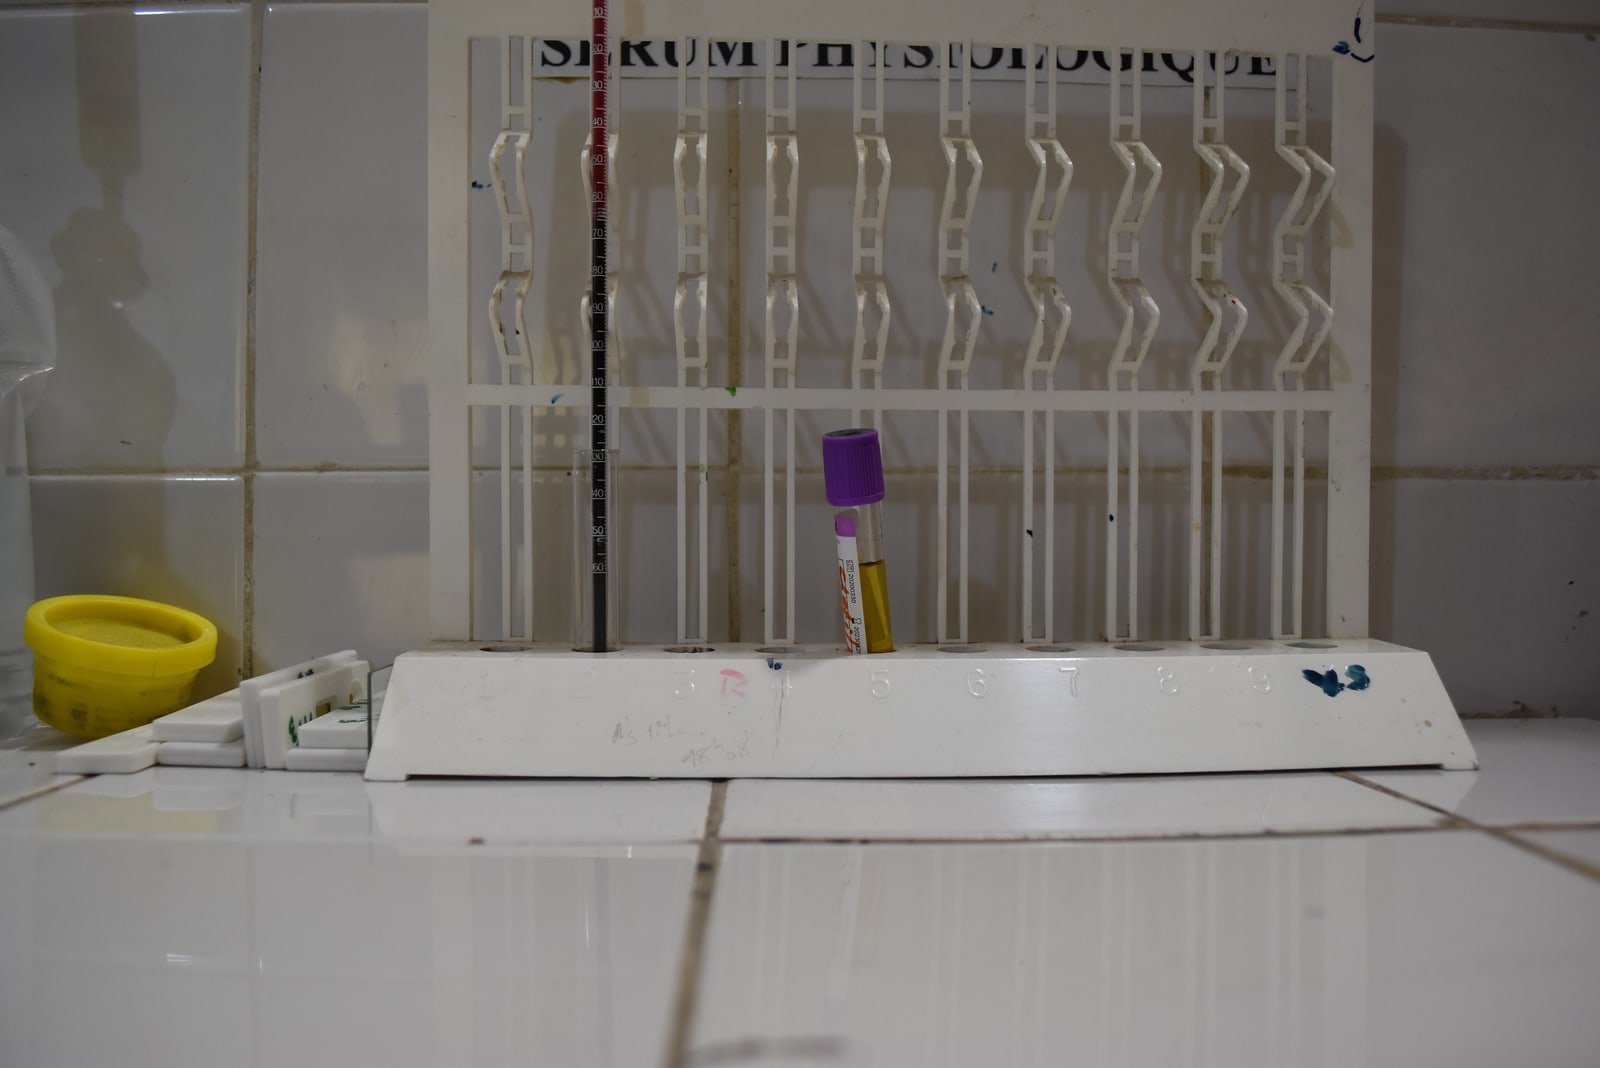
Blood enters a narrow upright tube, and the laboratory waits. As red cells settle, a clearer column of plasma appears above them. This quiet separation underlies the erythrocyte sedimentation rate, usually shortened to ESR or “sed rate,” a familiar blood test used to help investigate and monitor inflammation.[1][2]
The result looks deceptively direct: a number, a unit, perhaps a flag beside it. Yet the tube contains no scale marked in degrees of inflammation. It records the behaviour of a suspension of cells. Understanding what happens inside that suspension explains both the test's usefulness and the reasons a result cannot supply its own diagnosis.[1][2]
What the cells do together
Red cells can gather into stacks called rouleaux, resembling coins laid face against face. Plasma proteins, including fibrinogen, influence this aggregation. Changing the protein environment can therefore change how the cell suspension settles. This is the physical connection through which inflammation can affect the measurement.[4][5]
The process unfolds over time. The conventional description begins with a lag while cells aggregate, continues through faster sedimentation, and ends with slower movement as cells pack at the bottom. Reading the sample at a defined time captures the accumulated separation across these phases; it does not mean the cells have travelled at one steady speed throughout.[4]
Hematocrit—the fraction of blood volume occupied by red cells—also matters. Settling cells displace plasma upward, and that returning fluid interferes with their descent. Thus, the same protein environment need not produce the same measurement when the cell concentration changes. A 2022 laboratory study by Makoto Higuchi and Nobuo Watanabe explicitly incorporated hematocrit when estimating ESR from optical measurements of aggregation.[4]
A settling network
The familiar picture of separate clumps falling through fluid is useful, but research has made it less complete. In a paper published in February 2022, Anil Kumar Dasanna and colleagues combined experiments with simulations of individual cells. Their findings supported an account in which the red cells form a connected, gel-like network that collapses as plasma moves through it.[5]
Stronger attraction between cells produced a network with larger spaces. Those spaces made it easier for fluid to pass through, allowing faster sedimentation. Here, “gel” describes the physical organisation of the suspension; the experiment concerns sedimentation, not a blood clot.[5]
The result refines the mechanism rather than supplying a new rule for interpreting a patient's ESR: a protein can alter the reading by changing the architecture of a cell network.[5]
Making the wait comparable
The Westergren method dates to 1921. In its 2011 recommendations, the International Council for Standardization in Haematology specified a reference procedure using anticoagulated blood, defined dilution and pipettes with a sedimentation scale of at least 200 millimetres. The traditional reading is taken after 60 minutes.[2]
Those details make a physical event comparable between laboratories. The council also cautioned that cell size, shape and hematocrit can influence the result. Standardising the apparatus cannot remove biological differences in what has been put inside it.[2]
Automation adds another layer. A 2017 ICSH working group examined evidence including external quality-assessment surveys covering more than 6,000 laboratories on four continents. Only 28% of surveyed laboratories used the unmodified Westergren method; 72% used modified or alternative methods. These figures describe that survey, not the distribution of equipment today.[6]
The alternatives could be faster, safer and less labour-intensive, and some avoided a separate collection tube. But they did not necessarily yield interchangeable results. The group called for manufacturers to validate new methods, laboratories to verify their performance, and changes to be communicated to clinical users. A shared name on a report does not by itself establish that two instruments obtained the number in the same way.[6]
Returning the number to the patient
This chain of dependencies explains why ESR is interpreted alongside symptoms, medical history and other findings. MedlinePlus notes that age, sex and pregnancy can affect results, and that a person can have an inflammatory condition with a normal ESR. An abnormal result also does not automatically identify a condition requiring treatment.[1]
The test can still help follow an established illness or contribute evidence during an investigation. Its limits are part of that usefulness: the clinician must ask what could have changed the sample's behaviour before assigning the change to disease.[1][2]
At the rack, the observation is modest—a boundary has moved. Between that movement and a clinical judgment sit plasma proteins, cell concentration, the structure of the suspension and the method of measurement. Keeping those intermediate steps visible makes the number more intelligible, and less tempting to read as a verdict.[4][5][6]
Sources
- National Library of Medicine, “Erythrocyte Sedimentation Rate (ESR),” MedlinePlus — clinical uses, interpretation and limitations.
- J. M. Jou and colleagues, “ICSH review of the measurement of the erythocyte sedimentation rate,” International Journal of Laboratory Hematology 33 (2011), 125–132 — history, reference method and confounding factors; full text hosted by ISLH.
- Adoscam, photograph of sedimentation equipment in a health centre in Benin, 27 February 2021, Wikimedia Commons — image provenance.
- Makoto Higuchi and Nobuo Watanabe, “A rapid and accurate method for estimating the erythrocyte sedimentation rate using a hematocrit-corrected optical aggregation index,” PLOS ONE 17 (2022), e0270977 — settling phases, hematocrit and optical estimation.
- Anil Kumar Dasanna and colleagues, “Erythrocyte sedimentation: Effect of aggregation energy on gel structure during collapse,” Physical Review E 105 (2022), 024610 — open author manuscript deposited in 2021, with the final publication linked.
- A. Kratz and colleagues, “ICSH recommendations for modified and alternate methods measuring the erythrocyte sedimentation rate,” International Journal of Laboratory Hematology 39 (2017), 448–457 — laboratory survey and method-validation recommendations; official ICSH abstract.