The cleanest mistake in U.S. farm finance right now is to use land prices as a proxy for operating health. That shortcut misses the split that matters in 2026. Priced is that farmland has stayed surprisingly firm and sector-level support has kept aggregate stress from turning disorderly. New is that working-capital pressure is showing up faster in operating lines, renewals, and qualification than in the collateral itself.[1][2][3][4]
USDA's latest forecast captures the tension. Net farm income is forecast at $153.4 billion in 2026, down 0.7% from 2025, while net cash farm income is forecast at $158.5 billion, up 3%; direct government payments are forecast to jump to $44.3 billion.[1] That combination explains why the sector does not look like a panic case. It does not mean every borrower is comfortable. It means the shock is being absorbed unevenly.
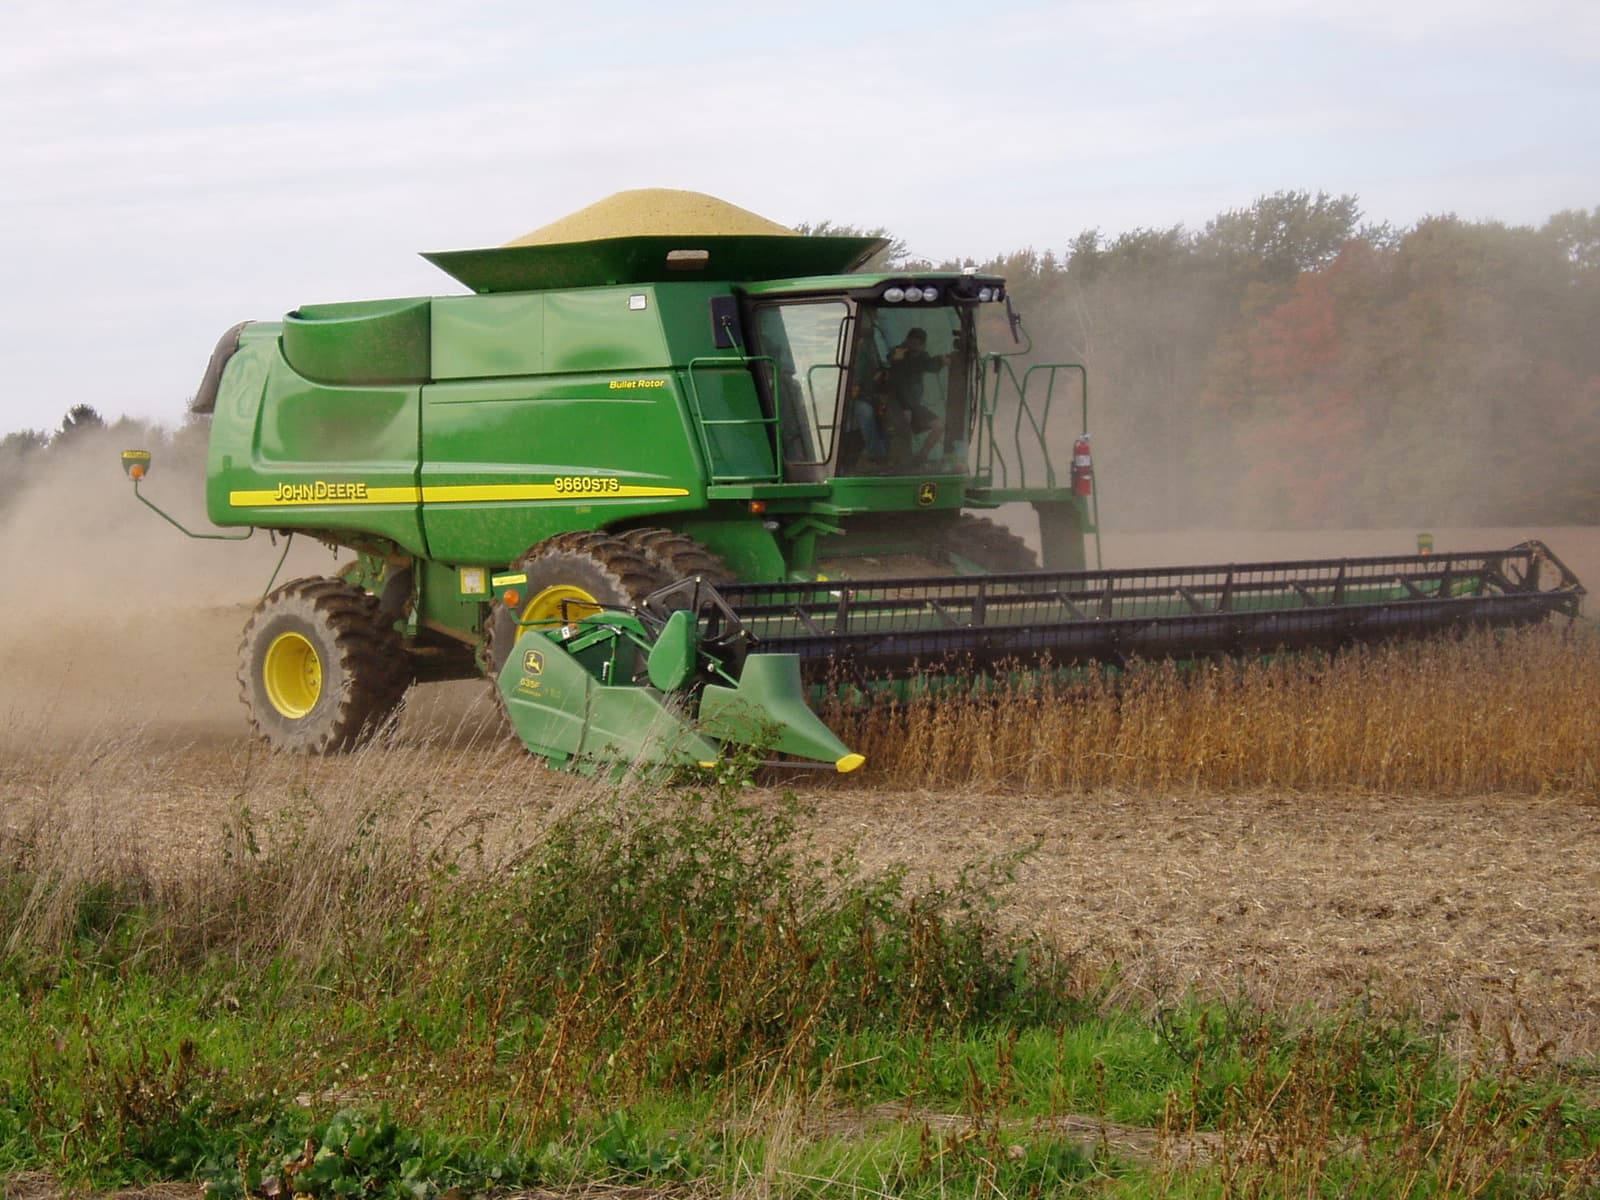
Image context: the cover uses a real soybean-harvest photograph because this article is about actual operating agriculture and credit transmission, not an abstract commodity graphic.[7]
Mechanism: collateral and liquidity are moving on different clocks
Start with the cushion. Land values have not broken the way many people would expect after a weak crop stretch. In the Kansas City Fed's Tenth District, lenders said nonirrigated cropland was nearly unchanged from a year earlier in 2025 while ranchland values still rose modestly.[2] In the Chicago Fed's Seventh District, the value of good farmland was up 6% from a year earlier in the fourth quarter of 2025.[3]
Those land numbers matter because they keep balance-sheet damage from becoming immediately visible. A farm with strong real-estate collateral can still refinance, renew, or restructure longer than a manufacturing borrower with the same cash-flow stress but a weaker asset base. Strong cattle economics, ad hoc government support, neighbor demand, and land demand tied to 1031 exchanges or energy and data-center development have also kept the land market from behaving like a pure crop-margin chart.[1][2][3]
Now look at where the pressure is actually surfacing. The Kansas City Fed says about 45% of farm borrowers in its region had current ratios below 1.5 at the end of 2025.[2] The Chicago Fed reported that 5.6% of loans had major or severe repayment problems, the highest share since mid-2020, and that 3.8% of customers who received operating credit in 2025 were not likely to qualify for it in 2026.[3] That is the real transmission channel. Liquidity weakens, then renewals and extensions rise, then credit standards and collateral demands get a little less forgiving.
The national lending data point in the same direction. In the Kansas City Fed's national survey of terms of lending to farmers, the volume of new farm operating loans rose nearly 40% year over year in the fourth quarter of 2025, the average size of farm operating loans during 2025 was 30% larger than the prior year after inflation adjustment, and more than 80% of non-real-estate loans carried floating rates in the fourth quarter.[4] In other words, farmers are leaning harder on short-duration operating credit at the same time a large share of that credit is still rate-sensitive.
Why the split matters for finance
This is why farmland resilience can mislead investors, lenders, and operators. Land is the slow-moving collateral layer. Operating credit is the fast-moving cash-flow layer. The first can stay stable while the second gets tighter for several quarters.
That distinction matters for three reasons.
First, it changes how to read agricultural banks. If land values stay firm, loss severity can remain contained even while loan demand rises and repayment quality softens. That can keep bank earnings looking better than the underlying working-capital picture for crop borrowers.[2][4]
Second, it changes how to read farm-equipment and input demand. A farmer does not need a collapse in land prices to delay machinery, land improvement, or expansion decisions. The Chicago Fed's February survey already showed bankers expecting lower levels of land purchases, land improvements, and machinery buying because operators were becoming choosier with working capital.[3]
Third, it changes how to read policy support. Direct government payments and resilient collateral can buy time, but they do not automatically restore operating margins for row-crop producers. Time is useful. It is not the same thing as a new profit cycle.[1][2][3]
Six numeric anchors
- Sector profits: USDA forecasts $153.4 billion of net farm income for 2026, down 0.7% year over year.[1]
- Sector cash flow: USDA forecasts $158.5 billion of net cash farm income for 2026, up 3%, with direct government payments rising to $44.3 billion.[1]
- Land still firm: good farmland in the Chicago Fed district was up 6% year over year in Q4 2025.[3]
- Liquidity strain: about 45% of Tenth District borrowers had current ratios below 1.5.[2]
- Repayment stress: 5.6% of Chicago Fed district loans had major or severe repayment problems, and 3.8% of 2025 operating-credit customers were not likely to qualify in 2026.[3]
- Operating-credit pressure: Q4 2025 operating-loan volume rose nearly 40% year over year, average operating-loan size in 2025 was 30% larger, and more than 80% of non-real-estate loans had floating rates.[4]
Put together, those anchors describe a sector where the collateral layer is still cushioning the system but the liquidity layer is steadily getting less comfortable.
Strongest counterweight
The best counterweight is that farmland is not holding up by accident. Real collateral, stronger cattle incomes, and bigger government payments can keep lenders patient for longer than many macro observers expect.[1][2] If crop receipts stabilize and cash rents stay attractive relative to rates, the current squeeze can remain a rollover-and-workout story instead of becoming a broad credit event.
That is why this is not a crash thesis. The narrower claim is that the tighter part of the cycle is already visible in operating credit even though the collateral tape still looks calm.
Falsifier
This framework becomes too cautious if the next two to three reporting windows show a synchronized reset: row-crop profitability improves, repayment-problem shares stop rising, fewer borrowers fail qualification for fresh operating credit, and operating-loan demand cools without a break in farmland values. If those things happen together, the system is healing faster than this article assumes.[1][2][3][4]
Watchlist
- 2026-05-14 Chicago Fed AgLetter release: the first-quarter 2026 survey will show whether repayment problems, renewals, and land values are still moving in opposite directions.[5]
- 2026-08-13 Chicago Fed AgLetter release: this is the next clean read on whether planting-season financing pressure eased or carried into midyear credit conditions.[5]
- 2026-09-03 USDA farm income update: this release will test whether the current forecast for cash income and direct payments still offsets weak crop profitability.[6]
- 2026-12-02 USDA farm income update: this is the year-end official check on whether the cushion was enough to keep stress contained through the full crop cycle.[6]
Takeaway
U.S. farm finance in 2026 is easiest to understand as a two-clock system. Land values, collateral, and policy support are moving on the slower clock. Working capital, operating lines, and credit qualification are moving on the faster one. The slower clock is why the sector still looks orderly. The faster clock is where the tightening is already happening.
Sources
- U.S. Department of Agriculture Economic Research Service, "Highlights from the Farm Income Forecast" (updated February 5, 2026).
- Federal Reserve Bank of Kansas City, "Farmland Values Remain Firm Despite Deterioration in Farm Finances" (February 11, 2026).
- Federal Reserve Bank of Chicago, "AgLetter Insights: Farmland Values Rose While Credit Conditions Weakened" (February 2026).
- Federal Reserve Bank of Kansas City, "Larger Operating Loans Boost Farm Lending Activity in 2025" (January 30, 2026).
- Federal Reserve Bank of Chicago, "Chicago Fed Data Releases" (2026 AgLetter release calendar).
- U.S. Department of Agriculture Economic Research Service, "Farm Income and Wealth Statistics - FAQs" (2026 release dates).
- Wikimedia Commons, "Harvesting soybeans" image file.