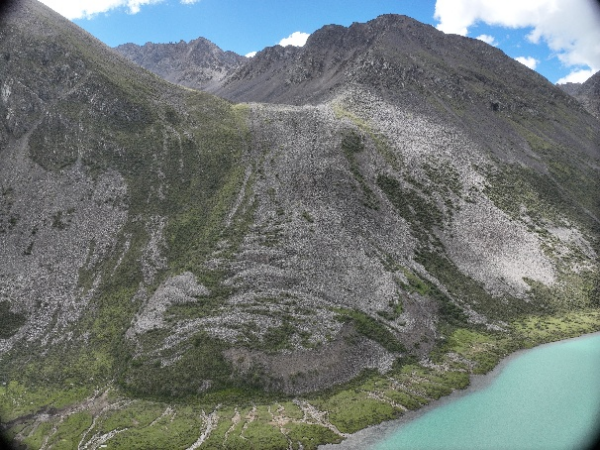
A mountain can acquire thousands of entries in a database while remaining the same mountain. That is the first thing to keep in mind when reading China's expanding AI-assisted inventories of rock glaciers. A 2024 catalogue, TPRoGI, recorded 44,273. In August 2026, the Institute of Tibetan Plateau Research publicized a separate inventory, TPRGI, containing 132,867 units.[1][2]
Those similar names invite a misleading comparison. The totals belong to different research projects, with different mapping choices. They cannot establish that mountain ice has multiplied. Read together with newer regional studies, they reveal something more useful: the work needed to turn a model's proposed outline into a landform that another scientist can investigate.
What counts as one glacier?
Rock glaciers form as ice-bearing debris creeps downslope. Their stony surfaces make them harder to recognize than an exposed sheet of ice.[1] Mapping them means deciding where a feature begins, where it ends, and whether adjoining lobes belong to one unit or several.
The 2024 TPRoGI study, led by researchers at the Chinese University of Hong Kong, used DeepLabv3+ to identify candidates in Planet satellite imagery. Its coverage excluded the Hindu Kush Himalaya region; its mapping rules excluded features smaller than 0.01 square kilometres. Human mappers corrected boundaries and separated connected units where their margins were visible.[2]
Even the performance figure needs its accompanying task. Across the study area, the model's F1 score was 0.63, calculated from the overlap between predicted areas and the manually improved inventory. The calculation uses areas correctly mapped, missed or falsely included. It does not mean every final boundary is “63 percent accurate.”[2]
The practical implication is that a catalogue total carries its method inside it. To explain the difference between two totals, researchers would need to compare their footprints and rules, then match the actual features. Subtracting the headline numbers skips that work.
Human additions can change the object being counted
A June 2026 Eastern Himalaya study makes the revision stage unusually visible. Its UNetFormer model proposed 8,206 polygons. After removals, boundary changes, splitting, merging and additions, the published inventory contained 10,552 units. The authors caution that the 4,600 newly added units cannot simply be called model misses: reviewers had access to finer imagery, in which features could be visible that the model's PlanetScope inputs did not resolve.[3]
This matters for evaluating the automation. A mapper who receives a sharper image has been given new evidence. Measuring the final catalogue against the initial predictions therefore mixes model performance with changes in what could be seen.
The same study supplies two linked layers: individual units and the larger systems formed by connected units. A single mountain feature can consequently contribute differently to a count depending on the layer selected. The intended scale of analysis determines which representation to use.[3]
The model travels; the inspection follows
A separate August 2026 study of the southeastern Tibetan Plateau pushed the search outward through training diversity. Xin Guo and colleagues used SegFormer trained on 19,096 rock-glacier samples assembled from across the world. Their final regional inventory contained 47,916 features.[4]
The researchers combined that broader training set with inspection of the predicted polygons, expert review of uncertain cases and checks against higher-resolution imagery and existing datasets. Drone-supported field surveys at three sites provided additional examples for assessing boundary reliability.[4]
That combination suggests a productive direction for Chinese scientific AI: models can make large searches tractable while field observations help establish what the resulting objects mean. Three surveyed sites offer valuable checks, although they cannot be treated as a visit to every mapped landform. The contribution lies in joining the scales of observation.
From an outline to a moving body
TPRGI adds another dimension. The Institute of Tibetan Plateau Research combined deep learning with radar observations over time and reports surface-deformation measurements for 99.3 percent of its inventoried units.[1] This is measurement coverage; it does not say that the same proportion is moving rapidly or poses a hazard.
The distinction becomes sharper when the map is used to discuss water. A separate Peking University study of Guokalariju, published in January 2024, estimated underground ice using mapped area, modeled thickness and assumptions about ice content. Different thickness methods produced substantially different water-storage estimates.[5]
That regional study supplies a caution about the inference, rather than the exact recipe used by TPRGI. An outline constrains area. Estimating the ice beneath it requires additional information, and estimating when water might reach a river requires more again. A catalogue can direct those investigations without already containing their answers.
Taken together, these projects suggest that the next valuable comparison is a shared patch of mountain: the same imagery, explicit counting rules, independently reviewed outlines and repeat measurements. Such a comparison could show whether a new model finds overlooked terrain, draws better boundaries or saves expert time. The growing inventories have made that test possible—and given researchers many more places where it is worth looking.
Sources
- Institute of Tibetan Plateau Research, Chinese Academy of Sciences, “Tibetan Plateau rock-glacier inventory released” (August 24, 2026; Chinese-language institutional report)—TPRGI methods, totals, deformation coverage and the Jiali drone photograph.
- Zhangyu Sun and colleagues, “TPRoGI: a comprehensive rock glacier inventory for the Tibetan Plateau using deep learning,” Earth System Science Data (December 17, 2024)—coverage, mapping rules and validation.
- Shijun Wang and colleagues, “An updated inventory of rock glaciers in the Eastern Himalaya,” Scientific Data (June 27, 2026)—model predictions, manual revision and linked unit/system layers.
- Xin Guo and colleagues, “Rock glaciers of the Southeastern Tibetan Plateau: A large-scale inventory derived from deep learning and high-resolution imagery,” Scientific Data (August 5, 2026)—author-affiliated CUHK research record and abstract.
- Mengzhen Li and colleagues, “Assessment of rock glaciers and their water storage in Guokalariju, Tibetan Plateau,” The Cryosphere (January 2, 2024)—thickness models, ice-content assumptions and storage uncertainty.