A forecast can put a storm in roughly the right place and still lose the detail that makes it useful. A narrow band of intense rain matters differently from a broad wash of moderate rain. NowcastNet, introduced in July 2023, tried to preserve that distinction. Its most memorable result came from people: in an evaluation involving 62 Chinese meteorologists, it ranked first in 71% of cases.[1]
That number rewards a closer reading. It describes expert preference among competing forecasts. Understanding how those preferences were collected—and what happened when another research team tried to adapt the model—makes NowcastNet a revealing case in China’s scientific AI development.
Giving the rain a physical direction
Tsinghua University’s Chinese-language announcement traces the collaboration with the National Meteorological Center and National Meteorological Information Center to 2017. By July 2023, the university reported deployment on the national SWAN 3.0 nowcasting platform.[1] That is a dated institutional report of deployment; this article examines the published research, without claiming an audit of today’s service.
The model combines two kinds of work. An evolution network learns the movement and changing intensity of precipitation with a continuity-equation-based operator. A generative network then uses that evolving field as a condition for producing finer detail. Tsinghua describes the division in physical terms: larger-scale motion and smaller-scale convective development.[1]
This is an interesting use of generation because visual plausibility is only the beginning. Imagine a forecast that draws a convincing storm cell several towns away from the eventual downpour. Its texture could be excellent while its practical guidance is poor. The scientific task therefore needs evidence about both the structure of the forecast and its relationship to what actually happened.
Reading the vote
The Nature study trained models on US radar observations from 2016–2020 and tested them on 2021. For China, models pretrained on the US data were fine-tuned on observations from September 2019 through March 2021, then evaluated on April–June 2021.[2]
In the expert assessment, forecasts appeared anonymously in shuffled order. Each of the 62 meteorologists judged 15 randomly selected cases from extreme-precipitation subsets. One evaluation showed future observations so experts could compare predictions with the outcome. Another withheld those observations, asking them to judge from the preceding radar sequence. Comparators included pySTEPS, DGMR, and PredRNN.[2]
The difference between these exercises is consequential. With the outcome visible, a forecaster can assess a prediction against evidence. Without it, the forecaster is choosing guidance under uncertainty. Agreement between the two exercises would be valuable, but they answer different questions. A reader should resist compressing them into a single claim about how often tomorrow’s warning will be correct.
The paper also evaluated rainfall-location skill with a neighborhood version of the critical success index and spatial variability with power spectral density.[2] These measures supply another perspective alongside the human ranking.
The 71% headline is a preference result, not a probability that a particular forecast is right. Winning a comparison means being favored over the alternatives supplied in that comparison. It cannot, by itself, tell a town how often heavy rain will arrive, how many false alarms to expect, or whether a warning reaches people in time. Those require their own observations and denominators.
The observations already contain engineering
The US input came from the Multi-Radar Multi-Sensor system, or MRMS.[2] NOAA describes MRMS as an automated system integrating radar streams with other observations and model information to produce weather products. Its work includes mosaics, quality control, and precipitation estimation.[3]
Calling such material “radar data” can hide the decisions upstream of a neural network. A mosaic has to assemble observations into a usable field. Quality control helps decide which measurements deserve trust. A learning system inherits that processed view of the atmosphere.
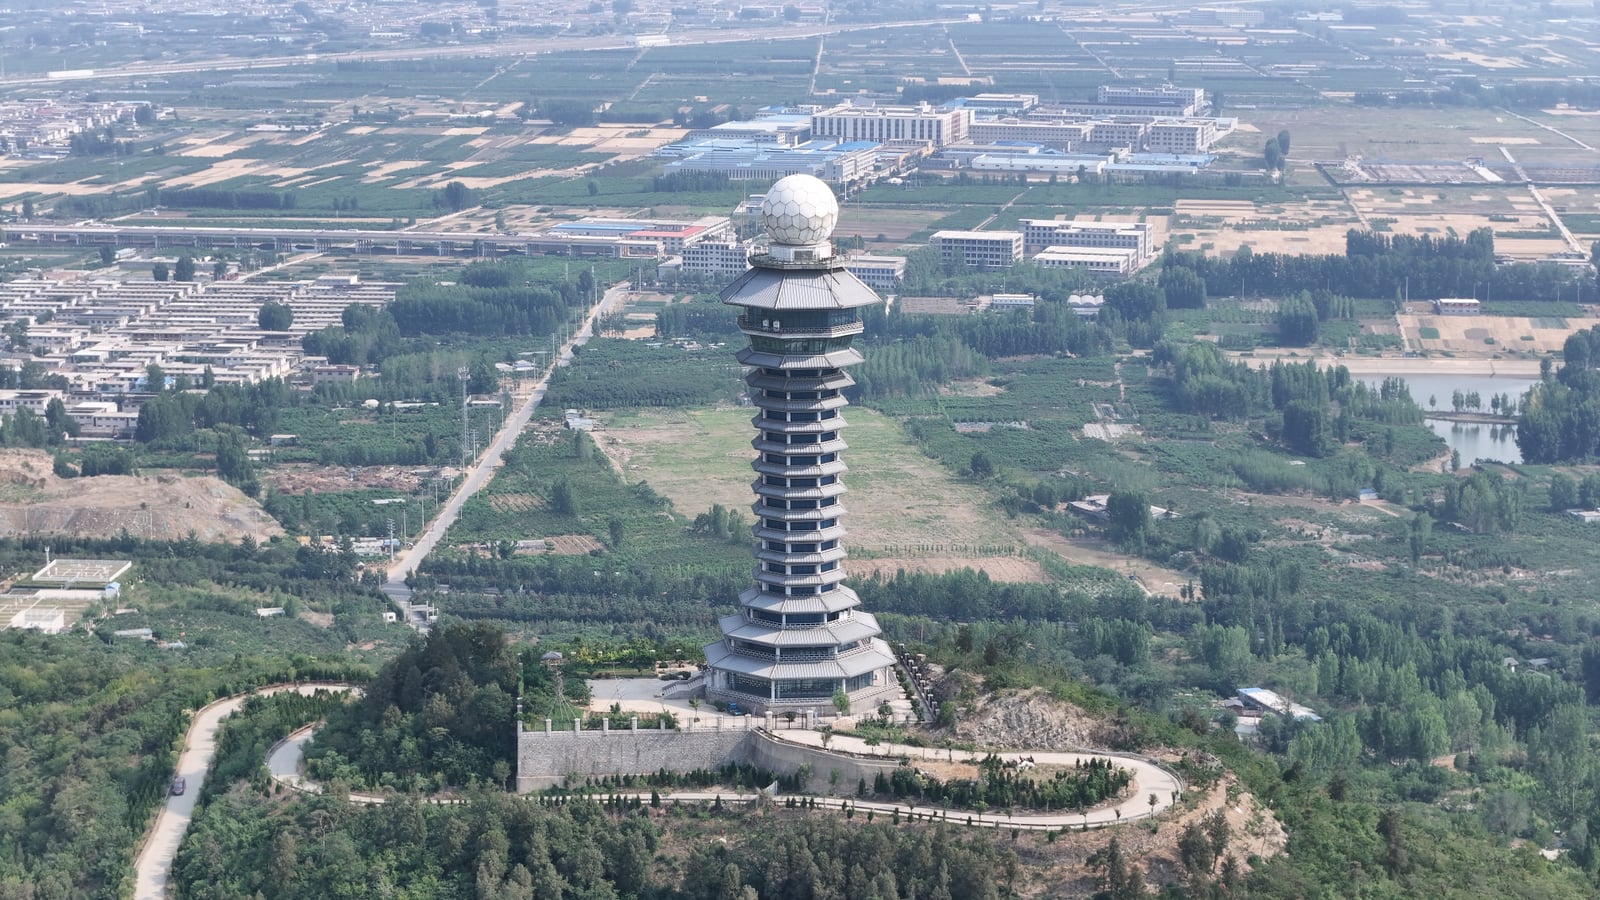
The photographed radar tower at Chayashan in Linyi makes the physical side of this work visible.[5] It is an illustration of observation infrastructure, with no claim that this particular tower contributed to the study. The building, instrument, and surrounding landscape belong in the story because weather AI begins with measurements made somewhere.
Canada supplied a second test
A 2025 conference paper by researchers at Environment and Climate Change Canada and IBM Research examined local adaptation. They reported that inference code and pretrained weights were available, while the original training code and full dataset were not shared. They implemented a training procedure and tried fine-tuning on Canadian radar composites.[4]
Their preparation included resampling observations to ten-minute intervals and two-kilometer spacing. June 2023 served for validation; July–August 2023 supplied the test period. Verification used an inner region within a larger input crop to reduce boundary effects. Under this setup, the fine-tuned version failed to improve the reported scores over the original model.[4]
The authors proposed a possible explanation: the pretrained generator had to work with a discriminator trained from scratch. They also kept the evolution network frozen after being unable to fine-tune it. These are limitations of the attempted adaptation. The figure notes a further comparison detail: scores were computed at 30-minute intervals for the original version and 10-minute intervals for the fine-tuned version.[4]
The result is useful precisely because it does not settle every question. It shows that supplying local observations and additional training is insufficient to guarantee improvement. It also leaves room for a better adaptation procedure. The released prediction system, the recipe needed to retrain it, and the evidence needed to trust the retrained version are distinct research contributions.
What to watch
My reading is that NowcastNet’s enduring contribution includes the shape of its evaluation: ask practicing forecasters, conceal model identity, distinguish judgment with hindsight from judgment without it, and retain numerical checks.
A stronger follow-up would carry those habits into another season or radar network, report results separately by lead time and rainfall threshold, and measure both missed events and false alarms. That would give the next headline a clear meaning. The achievement worth carrying forward is a forecast whose advantages remain visible when the conditions of the test change.
Sources
- Tsinghua University School of Software, NowcastNet announcement, July 7, 2023 (Chinese); first-hand account of the collaboration, architecture, expert assessment, and reported deployment.
- Yuchen Zhang et al., “Skilful nowcasting of extreme precipitation with NowcastNet,” Nature 619, 526–532, July 5, 2023; training/test splits, meteorologist protocol, comparison methods, and quantitative evaluation.
- NOAA National Severe Storms Laboratory, “Multi-Radar/Multi-Sensor System (MRMS)”; official description of the observation-processing system, checked September 25, 2026.
- Dominique Brunet, Daniel Salles Civitarese, and Didier Davignon, “An Improved Implementation of NowcastNet with Fine-Tuning for Canada,” 41st International Conference on Radar Meteorology, 2025; extended abstract, sections 3–5 and Figure 4.
- WPTO, photograph of the Chayashan weather-radar observation tower in Linyi, June 10, 2024; Wikimedia Commons, CC BY 4.0.