“Automatic detection” can describe two quite different jobs. One is to draw the boundary of a structure inside an image already centred on its known coordinates. The other is to search an open landscape, decide whether a structure is present at all, and locate it without being told where to look. A paper published in npj Heritage Science on March 17, 2026, demonstrates a credible result on the first job. Its headline metric does not yet establish the second.[1]
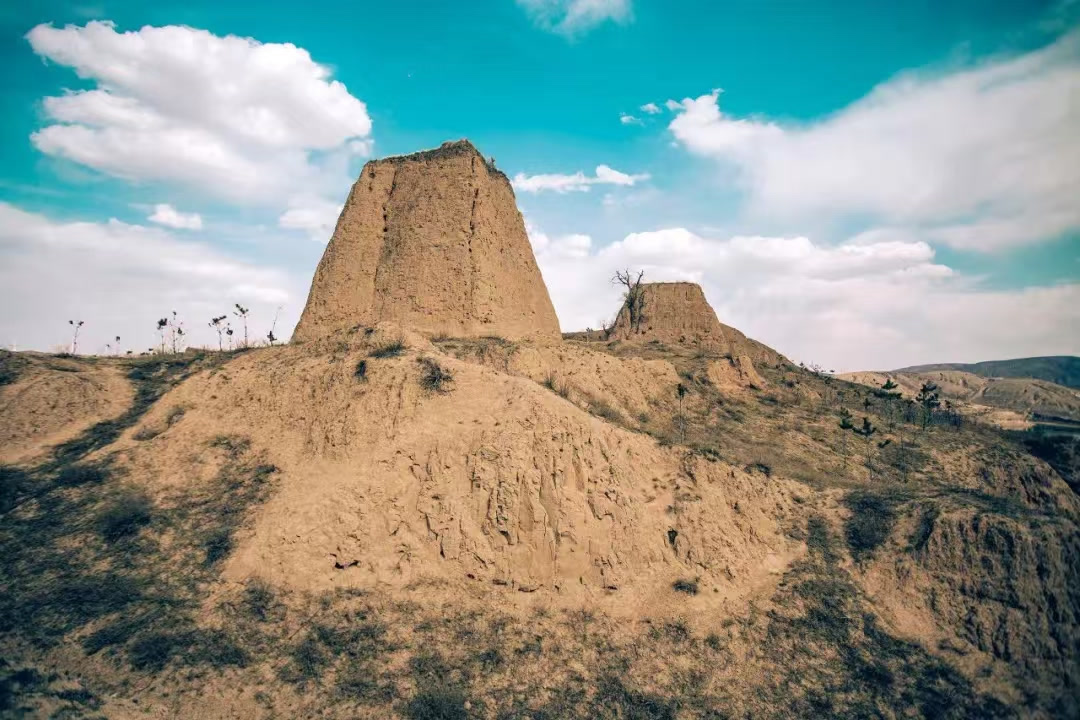
The study introduces IHBSegNet, a neural network for segmenting individual heritage buildings along the Great Wall: principally watchtowers and beacon towers that can be small, eroded, and visually entangled with the loess around them. On its held-out image patches, the model reached 73.02% intersection over union (IoU), 84.41% F1, and 84.01% recall. It then supplied masks for a second analysis that grouped annual satellite embeddings into four vegetation-density classes and looked for shifts around each structure from 2017 through 2024.[1]
That is useful work. Yulin already combines human protectors with drones, video, and a municipal inspection platform; a machine-generated queue could help those people decide where to look first.[4] But a useful triage layer is not the same thing as an autonomous Great Wall survey, and a vegetation shift is not a damage verdict. The benchmark becomes more informative—not less—when its evaluation boundary is made explicit.
The benchmark begins with the answer to “where?”
The study area covers about 254.64 kilometres of Great Wall remains in Fugu County, Shenmu City, and Yuyang District, all within Yulin in Shaanxi Province. The researchers began with 604 known heritage-building coordinates: 198 in Fugu, 211 in Shenmu, and 195 in Yuyang. Around those points they collected 586 high-resolution RGB scenes from Google Earth, each covering 50 by 50 metres at 0.5-metre resolution. The images span 2014–2024 and were individually selected for maximum clarity.[1]
That sampling choice answers a legitimate conservation question: given an inventory point and a relatively clear overhead view, how accurately can a model delineate the surviving structure? It does not answer how often the model would find an unregistered tower in hundreds of square kilometres of visually similar terrain.
The scenes were cut with a 512-by-512-pixel window moving in 256-pixel steps. Patches without a heritage building were discarded, leaving 905 samples, which were randomly divided 80:20 for training and testing. Remote-sensing interpreters drew the masks and archaeologists reviewed them—a valuable layer of domain quality control.[1] Yet the resulting test set is deliberately site-centred and positive-only. It contains background pixels around towers, so the segmentation score still penalizes many boundary mistakes, but it does not expose the model to the prevalence of entirely empty land that an open search would encounter.
What 73.02% IoU actually certifies
IoU measures the overlap between a predicted mask and the reference mask divided by their union. A score of 73.02% is the most helpful of the three headline metrics because it penalizes both missed structure and extra area. The 84.41% F1 and 84.01% recall complete the within-dataset picture. Together, they say IHBSegNet drew reasonably strong masks on held-out patches produced by this pipeline, outperforming the comparison networks reported in the paper.[1]
The score does not provide object-level recall across a corridor, false alarms per square kilometre, or performance on a county absent from training. There is also a split question. The paper describes generating overlapping patches and then making a random train/test division, but it does not say that patches were grouped by original 50-metre scene or by heritage site. The published protocol therefore does not rule out closely related spatial context landing on both sides of the split. That is an evaluation risk, not proof that leakage occurred. A site-grouped split manifest would settle it; a leave-one-county-out result would test geographic transfer more directly.[1][2]
Image selection narrows the envelope again. Choosing the clearest Google Earth view from a 2014–2024 window is sensible for building a first labelled corpus, but it avoids some of the operational conditions that most need automation: fresh occlusion, seasonal cover, poor contrast, new erosion, and inconsistent current imagery. The right reading is therefore specific: 73.02% IoU is evidence for known-site, clear-image semantic segmentation within this Yulin corpus. It is not an accuracy claim for unknown-site discovery or for every present-day patrol image.
The second model produces a patrol cue, not a diagnosis
After segmentation, the study overlays each predicted building area on Google's annual Satellite Embedding dataset. That product represents every 10-metre pixel with 64 learned dimensions; individual bands are not independently interpretable, but distances in the embedding space can support classification and change analysis. The public collection currently spans 2017–2024.[3] The researchers cluster the pixels into four ordinal classes—non-vegetated, sparse, moderate, and dense—and compare each site's mean class and a normalized vegetation score across years.[1]
IHBSegNet produced usable masks for 550 of the 604 inventory points: 174 in Fugu, 177 in Shenmu, and 199 in Yuyang. The analysis then highlighted sites with large vegetation-class movements. Most of the pronounced shifts reported in Fugu and Yuyang moved toward denser cover, which could indicate encroachment, reduced disturbance, or ecological recovery. The annual embedding cannot distinguish those mechanisms by itself.[1]
Nor is the alert count completely clean. The abstract says 67 sites showed significant change. In the county-level results, the same threshold identifies 32 in Fugu, 35 in Yuyang, and four in Shenmu—71 when all three counts are included; 67 is exactly the Fugu-plus-Yuyang subtotal. A site-level output table and an explicit inclusion rule would resolve whether this is a wording difference or an arithmetic inconsistency before the number enters an operational dashboard.[1][2]
The authors' own sensitivity analysis supplies another important warning. Because these buildings occupy small footprints relative to a 10-metre vegetation pixel, moving a mask boundary by only three pixels can materially alter the mean vegetation-class shift; the normalized score is more stable. One embedding per year also smooths away seasonal changes. Most decisively, the study did not conduct field surveys to verify that a detected shift represented plant growth, let alone structural harm.[1]
Greener is not the same as more damaged
Vegetation can threaten earthen heritage. Deep roots can enter cracks, trap moisture, and destabilize masonry or rammed earth. China's National Cultural Heritage Administration accordingly calls for routine inspection and the control of deep-rooted plants at vulnerable Great Wall sections.[6] That policy supports targeted intervention after inspection; it does not convert every increase in green cover into a removal order.
The ecological evidence is more conditional. A field study of a northwestern Chinese Great Wall section found that vascular-plant diversity and moss-biocrust cover were associated with smaller and shallower erosion features. Its authors argue that plant communities and biological soil crusts can help control soil loss in some semi-humid settings.[5] Different roots, substrates, slopes, and positions on a structure can therefore change the conservation meaning of the same remote-sensing label.
IHBSegNet's vegetation layer should consequently phrase an alert as “cover changed here; inspect the site”, not “vegetation damaged this tower.” A useful field form would record plant type, root position, moisture, cracks, material loss, and whether the change occurred on the building fabric or merely around it. That turns a coarse annual signal into evidence a conservator can act on.
The release is inspectable, but not end-to-end reproducible
The accompanying Mendeley Data release is a meaningful positive. Version 2, published December 12, 2025 under CC BY 4.0, contains training and testing samples, quantitative results, vegetation-shift statistics, and analysis and visualization scripts.[2] Readers can inspect more than a paper table.
The package is not yet a push-button reproduction of the headline model. The paper says the PyTorch training and inference code are available from the corresponding author on request; no public model weights, environment lockfile, or clearly documented grouped split manifest accompanies the record.[1][2] For a conservation agency evaluating procurement or deployment, the missing receipts matter: stable site identifiers, original-scene provenance, image acquisition dates, exact splits, code and weights, dependency versions, raw predictions, and the frozen version of the annual embedding layer.
This is especially important for a time-series product. Google's catalogue notes that the embeddings are model-produced data rather than directly interpretable spectral bands.[3] Reproducibility requires recording the specific collection and processing version, not merely the years queried.
The field test that would change the verdict
Four additions would turn the current result into a much stronger deployment evaluation:
- Hold out geography, not random patches. Train on two Yulin jurisdictions and test on the third, then repeat. A harder extension would use a corridor with different soils, preservation, and imagery.
- Scan negative land. Tile a continuous area containing both registered sites and long stretches without buildings, then report object recall at a fixed false-alarm rate per square kilometre. This is the test required for an “automatic discovery” claim.
- Stress the hard cases. Publish performance by footprint size, occlusion, season, image age, erosion state, and contrast, with current drone imagery as a separate domain rather than treating a hand-selected clear historical view as the operating baseline.
- Validate alerts blind in the field. Send protectors a ranked list without revealing which sites the system marked as high change. Report how many top-ranked visits find relevant vegetation, how many find actual fabric risk, and how much patrol time the ranking saves.
Yulin is unusually well placed for that last step. Its official protection system already includes 68 protection stations, 305 protectors, monthly patrols, drone inspection, and a digital regulatory platform.[4] IHBSegNet need not replace that network to be valuable. It needs to improve the network's decisions measurably.
The model's best present role is therefore modest and practical: outline a known, visible structure; summarize where annual land-cover signals moved; and place a site in a human review queue. The machine proposes where to look. A conservator determines what is growing, whether it touches the historic fabric, and what—if anything—should be done.
Sources
- Daoyuan Zheng et al., “Automatic detection and site-scale vegetation shift analysis for individual heritage buildings along the Great Wall,” npj Heritage Science 14, 161 (March 17, 2026).
- Daoyuan Zheng et al., “Automatic detection and site-scale vegetation shift analysis for individual heritage buildings along the Great Wall,” Mendeley Data, version 2 (December 12, 2025).
- Google for Developers, “Satellite Embedding V1” Earth Engine Data Catalog (annual 10-metre, 64-dimensional embeddings for 2017–2024).
- Ministry of Culture and Tourism of the People's Republic of China, “陕西榆林:让长城文化真正‘活’起来” (August 29, 2024; Yulin's protectors, stations, drone patrols, video monitoring, and regulatory platform).
- Yanping Liu et al., “Vascular plant communities and biocrusts act as controlling factors in mitigating soil erosion on the Great Wall in a semi-humid area of Northwestern China,” Science of the Total Environment 918 (2024), 170515.
- National Cultural Heritage Administration, “国家文物局关于加强长城保护工作的通知” (December 11, 2023; inspection and control guidance for deep-rooted plants and other hazards).
- Great Wall National Cultural Park, “游走靖边、定边,看长城百年守望” (February 17, 2025; source page for the Zhenjing Fort photograph, credited to Yulin's official culture-and-tourism platform).