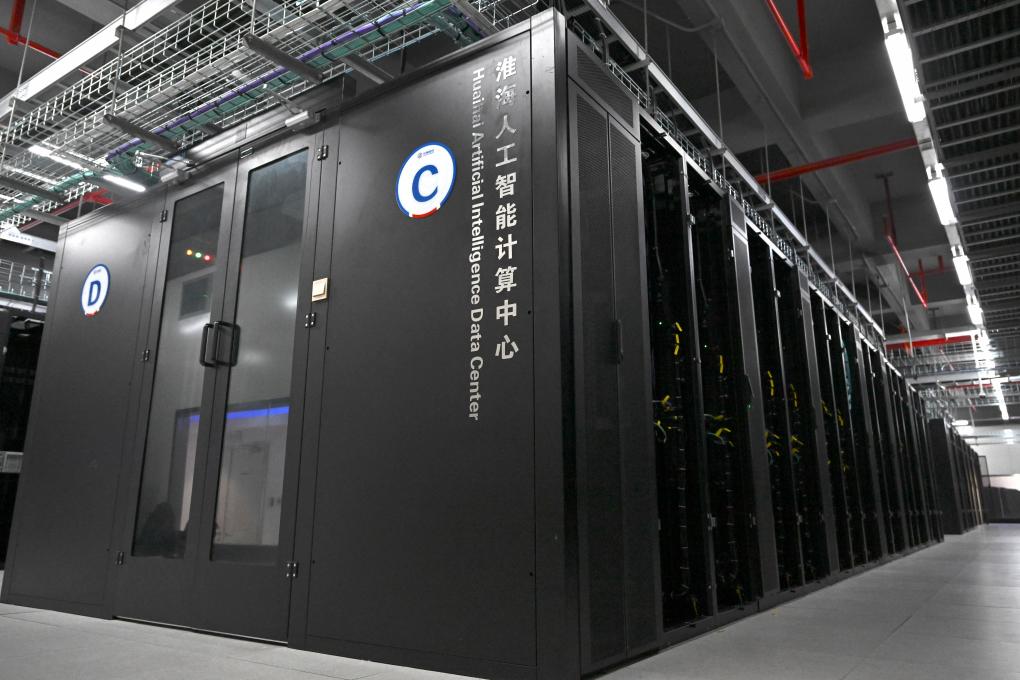

A model release usually erases its own working history. The public sees a checkpoint, a benchmark table, and perhaps a training-compute estimate; the queues, aborted jobs, repeated evaluations, checkpoint writes, and midnight recoveries disappear. Shanghai Artificial Intelligence Laboratory's 2024 NSDI presentation, “Characterization of Large Language Model Development in the Datacenter,” restores that missing middle. Its subject is not what one InternLM checkpoint can do. It is what had to keep happening around the checkpoint before anyone could trust it.[1][2]
The seventeen-minute talk condenses a six-month trace from March through August 2023 at the lab's anonymized Acme datacenter. Two clusters, Seren and Kalos, contained 4,704 NVIDIA A100 80GB GPUs and supported InternLM development at scales from 7 billion to 123 billion parameters. The researchers studied roughly 684,000 GPU jobs and 410,000 CPU jobs, combining scheduler metadata, hardware monitoring, runtime logs, and fine-grained profiles.[2][3] That is an unusually concrete window into China's foundation-model infrastructure: not a product-launch claim, but an operational record.
Watch for the changes in scale. A single pretraining run may occupy hundreds or thousands of GPUs, yet most submitted jobs are small. Evaluation barely registers in total GPU time, yet it can determine whether developers receive useful feedback soon enough to change the next run. Simple user errors are numerous, while comparatively rare infrastructure faults can destroy far more accumulated work. The talk's real argument emerges from those asymmetries: LLM development is a feedback system, and the quality of that system depends on how quickly it can observe, fail, recover, and try again.[2][3]
Around 2:00 — the unit of analysis becomes a pipeline
The opening pipeline slide is easy to pass over, but it establishes the article's most important boundary. Model development includes data preparation, pretraining, alignment, evaluation, and deployment; the Acme study examines the stages before serving and explicitly excludes deployment workloads.[1][2] Its traces therefore cannot tell us about user-facing latency, inference batching, cache behavior, or production demand. They show the workshop, not the storefront.
That boundary also prevents a common overreading. This is a 2023 A100-era, predominantly decoder-only Transformer workload, not a timeless description of every Chinese AI cluster. Multimodal models, large-scale reinforcement learning, mixture-of-experts training, domestic accelerators, and inference-heavy services can produce different resource patterns. The paper names several of those limits itself.[2] The value of the trace lies in making one important environment legible enough to compare with later ones, not in pretending that Acme represents an entire national industry.
Around 4:00 — “large-model jobs” turn out to be very short
The first visual surprise is job duration. Median GPU-job duration in both Acme clusters was only two minutes. Average duration was between 2.7 and 12.8 times shorter than in three earlier deep-learning traces from Microsoft, SenseTime, and Alibaba.[2][3] Faster hardware and more GPUs per job contributed, but so did the composition of the work: many small evaluations and debug attempts, plus an approximately 40 percent job incompletion rate.[2]
The comparison should be read directionally. It spans different years, hardware generations, organizations, and workload mixes; it is not a controlled benchmark of datacenter quality. What survives that caveat is the scheduling insight. A cluster designed only for the imagined months-long training run will misdescribe the actual development surface. It also has to absorb a storm of brief experiments, initialization failures, probes, and evaluations without letting the heaviest jobs monopolize every useful feedback channel.
Around 5:30 — job count and GPU time describe different worlds
Kalos makes the imbalance vivid. Evaluation represented 92.9 percent of its GPU-job count but only 0.8 percent of GPU time. Pretraining was just 3.2 percent of jobs and consumed 94.0 percent of GPU time.[2][3] In the same cluster, the largest five percent of jobs—those requesting more than 256 GPUs—accounted for about 96 percent of GPU time.[2]
This is not merely a colorful distribution. The lab reserved most capacity for pretraining, leaving evaluation to lower-priority spare resources. The result was counterintuitive: small evaluation jobs experienced the longest queues.[2] A model team can therefore protect expensive training utilization and still slow development overall, because researchers learn too late whether a checkpoint improved, regressed, or failed on a capability they care about. GPU occupancy is not the same thing as useful iteration speed.
Around 8:30 — evaluation stops looking like “just inference”
The HumanEval profile sharpens that point. For one 7B-model evaluation, model loading and data processing consumed 29.5 percent of elapsed time; synthesized program-correctness tests used another 19 percent while the GPU sat idle. Only about half the time went to GPU inference.[2][3] The bottleneck moved across storage, CPU work, and the scheduler even though the job was filed under model evaluation.
The response was to split the process at those boundaries. Models were fetched from remote storage once per node and then loaded locally over PCIe. CPU-only metric computation was detached from GPU inference. Trials were batched and ordered to balance known work across GPUs. In a representative 7B-model test spanning 63 datasets, this coordinator reduced makespan by 1.3 times on one node and 1.8 times on four nodes.[2] Those figures are not a general promise—the experiment is narrow—but the design principle travels: release scarce accelerators as soon as their part is finished, and schedule feedback as a first-class workload rather than leftover traffic.
After 10:00 — a failure count is not a failure cost
The failure table is the talk's most useful corrective to raw incident counting. Script mistakes such as missing files and type errors occurred often, usually early and on relatively few GPUs. Infrastructure failures were less frequent but arrived later, across much larger jobs. Just 54 recorded NVLink errors accounted for about 30 percent of the GPU time attributed to categorized failures; node, CUDA, ECC, and network faults added further concentrated losses.[2]
That does not mean 40 percent of the cluster's jobs ended because the hardware was unreliable. The broader incompletion figure mixes causes, including early user and framework errors.[2] The more defensible conclusion is about exposure: once a job occupies hundreds of GPUs for hours, a rare fault has an enormous blast radius. Reliability engineering must therefore weight failures by resources and lost progress, not only by how many tickets each error label produces.
In the closing minutes — the checkpoint becomes active infrastructure
The lab's recovery design begins by moving checkpoint state into host memory, then letting a background process persist it to storage while training resumes. The paper reports a 3.6-to-58.7-times reduction in checkpointing overhead across tested 7B and 123B cases, while carefully noting that the asynchronous measurement excludes the later storage-persistence time.[2] That qualification matters: the technique shortens the training pause; it does not make storage free.
Diagnosis follows a similarly layered path. Rules handle known error signatures; compressed logs and an LLM-assisted agent help classify unfamiliar failures; targeted tests isolate suspect nodes; recoverable jobs restart from a healthy checkpoint.[2] The authors estimate roughly a 90 percent reduction in manual intervention but explicitly call that estimate non-rigorous because the system was still evolving.[2] This is the right way to read an operational result: useful enough to motivate a design, bounded enough not to become a marketing guarantee.
What the trace changes
AcmeTrace's public repository makes anonymized job, failure, and hardware data available for inspection rather than asking readers to accept the slides alone.[4] The lab has since described a much broader research agenda, but the older trace remains valuable precisely because it captures a specific development regime and publishes its limits.[4][5]
For AI-China coverage, that changes the question worth asking. Open weights, benchmark scores, and accelerator supply still matter. So do the less visible clocks between checkpoints: how fast an evaluation reaches the front of the queue, how much model loading is duplicated, whether CPU work pins a GPU reservation, how often state is saved, and whether a failing node can be isolated without a long human investigation. The final model inherits the quality of those loops. The talk's lasting lesson is that infrastructure is not merely the floor beneath model research. It is part of the method by which the model becomes knowable.
Sources
- USENIX, “NSDI '24 — Characterization of Large Language Model Development in the Datacenter” (official presentation video).
- Qinghao Hu et al., “Characterization of Large Language Model Development in the Datacenter,” 21st USENIX Symposium on Networked Systems Design and Implementation (April 2024), paper, slides, scope, and experiment details.
- Qinghao Hu, Peng Sun, and Tianwei Zhang, “Understanding the Workload Characteristics of Large Language Model Development,” USENIX ;login: online (March 19, 2024), accessible written summary of the Acme traces.
- InternLM, “AcmeTrace” (official public repository for the anonymized Shanghai AI Laboratory workload and hardware traces).
- Shanghai Artificial Intelligence Laboratory, “Breaking Boundaries: AGI4S 2025 Breakthroughs and Explorations” (January 4, 2026), official institutional context on the lab's later research agenda.
- Xinhua, “What New Directions Are Regions Taking to Expand ‘AI+’ in 2026?” (January 30, 2026), source page and caption for Huang Bohan's documentary photograph of the Huaihai Artificial Intelligence Data Center.