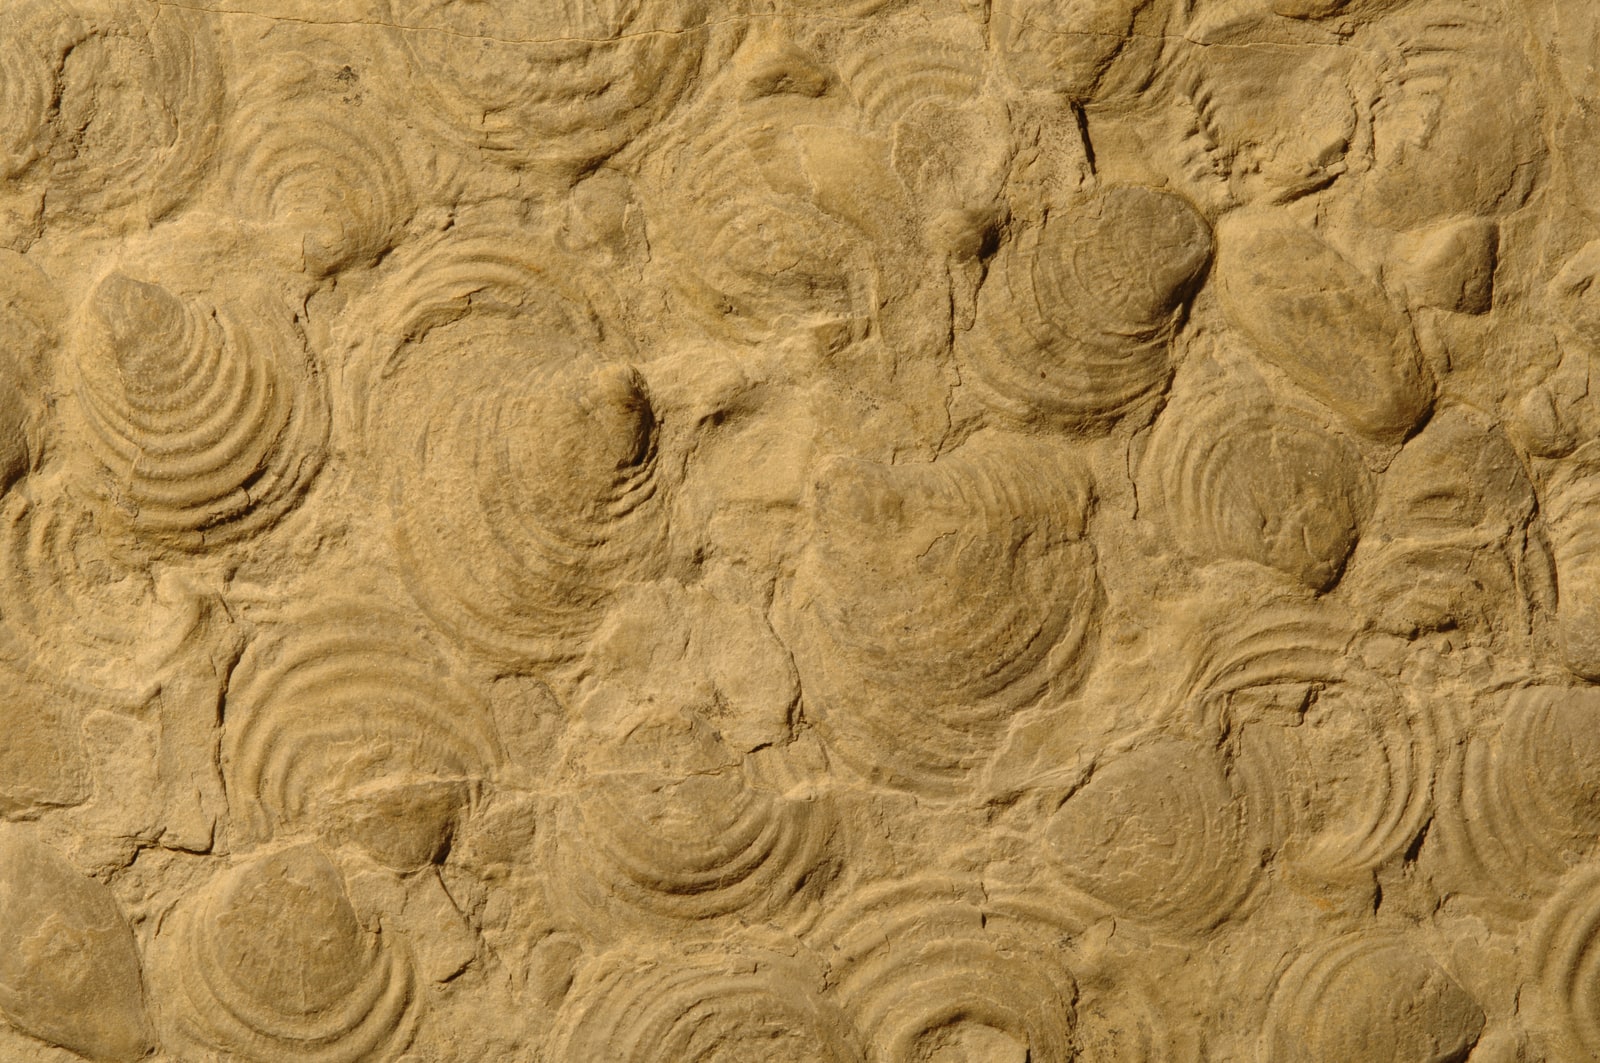
A shell bed can look crowded even when the wider animal world has been devastated. The Claraia shells in the photograph belong to a bivalve familiar from the Early Triassic, the interval following the end-Permian mass extinction around 252 million years ago.[1][5] Abundance on a slab offers no simple measure of how fully an ecosystem has recovered.
Size seems to offer a more immediate clue. Many fossils from the extinction's aftermath are conspicuously small. That observation helped make the Lilliput effect an enduring image of life after catastrophe: a diminished world rebuilding itself with diminished animals.[2]
But a ruler alone cannot explain the change. A collection can become smaller because its surviving species produce smaller bodies, because its largest species disappear, or because newly appearing species are small. Those histories can draw similar curves while describing different kinds of survival. The shells need their names back before their sizes become a biological story.
What became smaller?
Richard Twitchett's 2007 synthesis distinguished the original, narrow meaning of the Lilliput effect—a temporary size reduction within surviving taxa—from the broader observation that post-extinction faunas contain small organisms. The distinction matters because a change in membership can imitate a change within a lineage.[2]
Imagine a drawer containing three species, each with a different typical adult size. Remove the largest species and the drawer's average falls. Every remaining species could retain its former size. Alternatively, leave the membership unchanged but reduce the sizes reached within each species. The average falls again. This is an illustrative comparison, but it identifies the problem a fossil study must solve: changing bodies and changing membership are separate variables.
The word “shrinking” can obscure that separation. Nobody is proposing that a completed shell contracted. The question concerns the sizes attained by animals in successive populations, or the sizes represented by successive communities.
The broad pattern survives the exceptions
Ellen Schaal and colleagues tested the larger pattern in a 2016 study covering eight marine groups. Their database covered 11,224 specimens representing 2,743 species. Most groups showed sharp declines in maximum and median size among species across the Permian–Triassic boundary, followed by later increases.[3]
Ammonoids provided a revealing exception: their median size increased across the boundary, perhaps because of differences in habitat or physiology. The analysis supported both selective loss of large species and size reduction within surviving lineages. The widespread small-size interval was concentrated in the earliest part of the Early Triassic.[3]
The measurement matters. A median calculated from species-level size estimates gives each species a place without reconstructing its abundance. As a matter of interpretation, it cannot be read as the median animal living on an ancient seafloor.[3]
Growth leaves another kind of evidence
A small fossil might also be a young animal. To get beyond final dimensions, Brett Metcalfe, Twitchett and N. Price-Lloyd examined growth lines in well-preserved brachiopods assigned to “Lingula” from northern Italy's Werfen Formation. Their growth study appeared in 2011.[4]
The smaller specimens from the older Mazzin Member carried more growth lines, packed closer together, than larger specimens from the younger Siusi Member. The authors interpreted that combination as more frequent interruptions and slower overall growth in the immediate extinction aftermath.[4]
The shell's repeated additions reveal a history that its outer edge alone cannot supply. Yet growth interruptions do not identify a single environmental culprit. The authors considered low oxygen, temperature extremes and disrupted productivity among the possible stresses.[4] A growth record strengthens the biological interpretation without becoming a direct thermometer or oxygen gauge.
Give the bivalves their species names
A study published in February 2026 made the membership problem especially concrete. William Foster and colleagues measured bivalves from the Bellerophon and Werfen formations in the Italian Dolomites, following relatively shallow marine communities across the crisis.[5]
At the genus level, the familiar temporary reduction in size appeared. At the species level, the explanation changed: turnover was nearly complete, the newly appearing species were generally smaller, and the three species that survived showed no statistically significant body-size change. In this record, small successors largely produced the apparent dwarfing signal.[5]
Placed beside the brachiopod growth evidence, this result changes the question: which process produced the pattern in this particular group? The Italian bivalves caution against treating smaller size within surviving species as an automatic response to extreme warming.[4][5]
Return to the shell bed. Its crowded surface preserves bodies together, but it cannot supply their pre-extinction comparison, their growth histories or the species that vanished elsewhere. Those require other specimens, other beds and careful identification. The reward for that work is more interesting than a miniature world: an account of who endured, how they grew, and who took their place.
Sources
- Toedi3614, “Claraia.jpg,” Wikimedia Commons (2020) — photograph of a Claraia clarai shell bed, source description and attribution.
- Richard J. Twitchett, “The Lilliput effect in the aftermath of the end-Permian extinction event,” Palaeogeography, Palaeoclimatology, Palaeoecology 252 (2007), 132–144 — definitions and possible mechanisms; full paper hosted by the American Museum of Natural History.
- Ellen K. Schaal et al., “Comparative size evolution of marine clades from the Late Permian through Middle Triassic,” Paleobiology 42 (2016), 127–142 — eight-group comparison, measurement scope and ammonoid exception; institutional record.
- Brett Metcalfe, Richard J. Twitchett and N. Price-Lloyd, “Changes in size and growth rate of ‘Lilliput’ animals in the earliest Triassic,” Palaeogeography, Palaeoclimatology, Palaeoecology 308 (2011), 171–180, online 2010 — Werfen Formation growth-line evidence; institutional abstract.
- William J. Foster et al., “An unpredictable body size response to the Permo-Triassic climate crisis,” Biogeosciences 23 (2026), 1181–1198 — species turnover, surviving bivalves and the limits of a universal dwarfing prediction.