
When a Linux program reports “file not found,” “permission denied,” or simply “connection failed,” its log has often compressed a long sequence of decisions into one verdict. strace works in the opposite direction. It exposes the conversation at the user-kernel boundary: the system call a process made, the arguments it supplied, and the value or error the kernel returned.[3]
Michael Kerrisk's NDC TechTown 2018 talk is an unusually durable introduction because it does not treat that output as terminal confetti. Kerrisk—then the longtime Linux man-pages maintainer—builds a reading method from a tiny program outward: first understand one trace line, then account for libraries and child processes, then filter, and only after that consider timing or fault injection.[1][2] The commands have accumulated options since 2018, but the method still matches the current manual.[3][6]
Watch for three shifts. The first is from application vocabulary to kernel vocabulary. The second is from collecting everything to asking a narrow question. The third, late in the talk, is from observing a failure to manufacturing one. Together they make strace less like a wall of diagnostics and more like a controlled experiment.
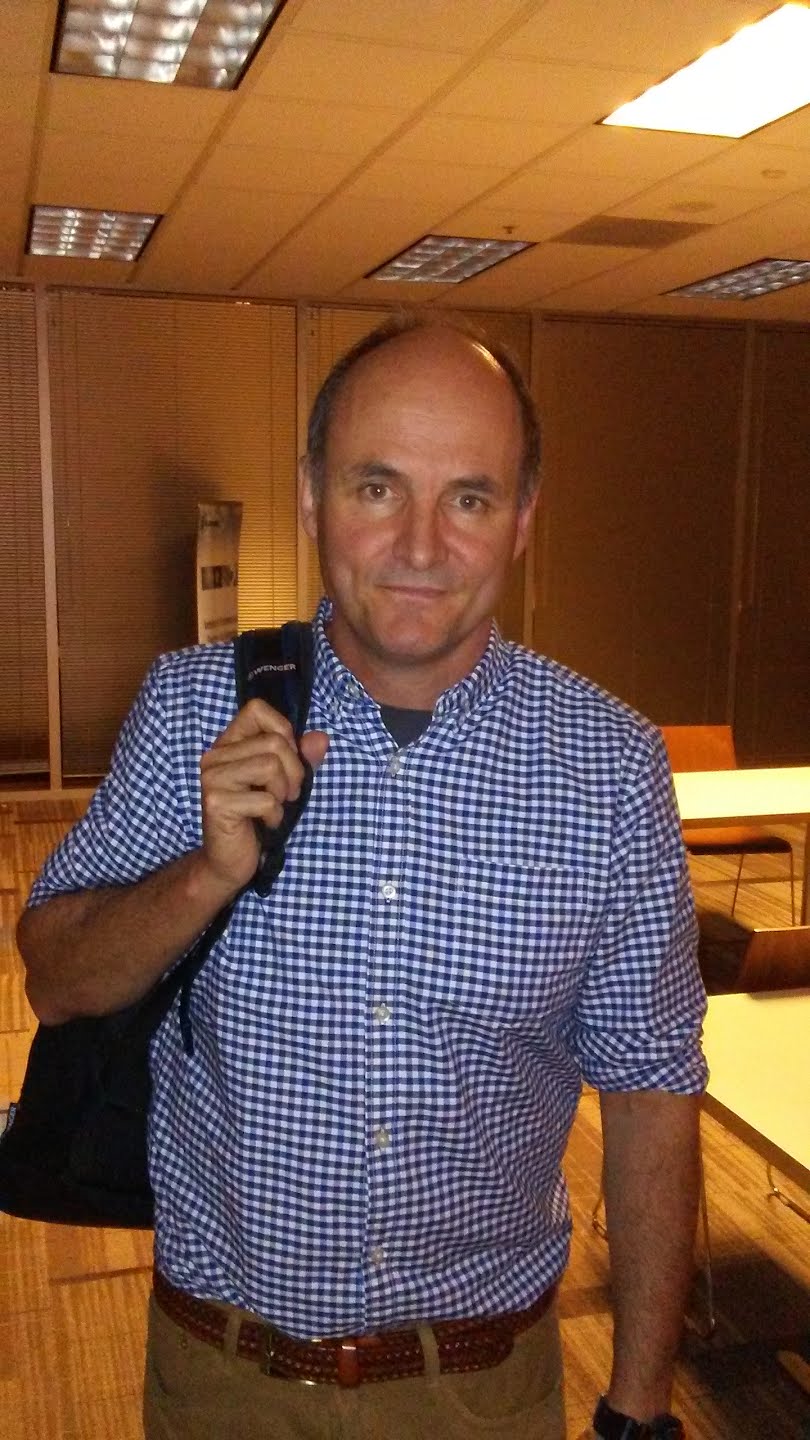
Image context: the lead photograph shows Kerrisk at a Silicon Valley Linux Users Group meeting in January 2018, seven months before the NDC presentation.[7]
Read each line as a kernel sentence
In the opening demonstration, a “hello world” program produces far more activity than its source suggests. Before the visible write, the process is executed, the dynamic loader looks for configuration and shared libraries, files are opened and mapped, and descriptors are closed. strace renders that traffic symbolically: call name, decoded arguments, return value, and, on failure, an errno name with explanatory text.[1][2][3]
That grammar is the first thing to learn. A line such as openat(..., O_RDONLY|O_CLOEXEC) = 3 says that the call succeeded and returned file descriptor 3. A return of -1 ENOENT says that this particular lookup found no path. It does not say that the program is broken. Loaders and applications routinely probe several candidate paths before one succeeds. A failed call is evidence; only its position in the sequence tells you whether it is the failure.
The talk's next surprise is that source-level names do not map neatly onto kernel calls. A C program can call exit(), while the trace shows exit_group(). A program can call a library wrapper named fork(), while the kernel boundary shows clone(). wait() may appear as wait4().[2] This is not inconsistency in the trace. It is a reminder that strace observes the ABI below libc and language runtimes. The tool is excellent for asking what reached the kernel; it cannot by itself recover the application-level intention that produced the call.
Around 16:00, filtering becomes the real skill
An unfiltered trace is comprehensive in the least helpful sense. Kerrisk's filtering section changes the exercise from “show me the process” to “show me its file, network, process, signal, or memory-mapping behavior.” The category filters—today written as sets such as %file, %network, %process, and %memory—avoid hand-maintaining lists of individual syscalls. -P narrows activity to a path, while -y and -yy connect otherwise anonymous descriptor numbers to paths, pipes, sockets, and protocol details.[2][3]
Process scope is equally important. By default, a command may hand the interesting work to a child that disappears from view. -f follows processes created through fork, vfork, or clone; when attached with -p, it can cover every thread in the selected process.[3] That power should be deliberate. Following an entire worker tree can turn one useful question into thousands of interleaved lines.
A practical trace therefore begins with a hypothesis. For a configuration failure, start with the shortest reproducible command, save output with -o, follow children only if the work escapes, and filter to file calls. For a refused connection, switch the family to network calls and decode descriptors. For a hang, add timestamps and call durations, but compare the blocked call with surrounding threads rather than declaring the longest line the cause. Brendan Gregg's production examples make the same broader point: short traces can reveal a hidden dependency quickly, while broad tracing carries real overhead and interpretive risk.[5]
At 26:24, the observer becomes a fault injector
The most memorable turn comes when Kerrisk uses -e inject=... to alter a chosen syscall. His example targets the third close, prevents the real call, and returns EINVAL instead. The loader then enters an error path that would be awkward to summon with ordinary input.[1][2] Current strace can inject error returns, success values, signals, and entry or exit delays, with an expression selecting which invocation is affected.[3]
This feature changes what the tool is for. A trace can test whether cleanup, retry, and reporting code survives the kernel saying no. It can make a rare disk, descriptor, or timing failure reproducible without patching the application. But the boundary is sharp: fault injection is a test technique, not a production diagnostic. It intentionally changes program behavior, and a fabricated success value can be more dangerous than an explicit error. Use it against disposable data in a controlled environment, one named syscall and one expected path at a time.
At 34:21, the summary is a compass—not a profiler
Near the end, strace -c collapses a run into counts, errors, and time by syscall. This is useful for deciding where to inspect next. A process dominated by failed path lookups asks a different question from one spending its kernel time in poll, futex, or connect. The current manual is precise about the measurement: the summary reports time spent in the kernel, estimates tracing overhead, and can aggregate followed processes.[3]
It is still an instrument inside the experiment. Traditional syscall tracing stops the tracee at entry and exit so the tracer can inspect arguments and results; that mechanism explains both the visibility and the perturbation.[4] Modern strace --seccomp-bpf can reduce stops to the syscalls selected by a filter when tracing a newly launched process with -f, but it does not apply to -p attachment and can fall back to ordinary tracing.[3] “It was slow under strace” is therefore not a performance diagnosis.
The safe operating boundary follows from that cost. On a developer machine or staging host, tracing a short command is reasonable even for a one-person team. On a busy production service, the team needs a specific PID, a narrow filter, a short capture window, an output destination with enough space, and an acceptable latency risk. If the question requires continuous, fleet-wide, low-overhead observation, use a profiler or tracing system designed for that job; bring strace back when the investigation has narrowed to one process and one kernel-facing mystery.
Kerrisk's talk lasts because it teaches a sequence, not a bag of flags. Translate the complaint into a kernel-boundary question. Capture the smallest process tree that can answer it. Filter before reading. Treat errors as events in context. Use summaries to choose a lane, not to crown a culprit. And manufacture failure only when the environment is built to absorb it. Once those habits are in place, strace stops looking noisy. It becomes a remarkably literal witness—powerful precisely because it never claims to know what the application meant.[1][2][3]
Sources
- NDC Conferences, “Strace: Monitoring The Kernel-User-Space Conversation — Michael Kerrisk,” NDC TechTown 2018 — embedded conference talk.
- Michael Kerrisk, “System Call Tracing with strace,” NDC TechTown 2018 — speaker slides covering trace grammar, child processes, filters, descriptor decoding, fault injection, summaries, and attachment risk.
- The strace project,
strace(1)manual — current syntax and behavior for filtering, following processes, decoding descriptors, injection, summaries, and seccomp-BPF acceleration. - Linux man-pages,
ptrace(2)— syscall-entry and syscall-exit stops underlying traditional system-call tracing. - Brendan Gregg, “strace Wow Much Syscall” — independent production-debugging examples and cautions about tracing overhead.
- strace project website — project scope, releases, documentation, and upstream links.
- Eugene Zelenko, “Michael Kerrisk,” Wikimedia Commons — source page for the January 2018 Linux user-group photograph.