A rock sample has a present-day address. The event it records may have happened somewhere else. GPlates gives geologists a way to investigate that distance: load observations, attach them to a plate reconstruction, and examine their positions through geological time. The free, open-source desktop application combines a globe you can manipulate with data you can question.[1][3]
It is a useful project to encounter when an ancient-world animation leaves you wanting to ask something of your own. Where would this sample sit under a different reconstruction? Which assumptions made those two regions neighbors? GPlates lets a reader of geological maps begin working with the model behind them.
The entry point is reasonably tangible. As checked on October 9, 2026, the official download page lists GPlates 2.5 as the stable desktop release and pyGPlates 1.0.0 as the stable Python library. Desktop packages for Windows, macOS, and Ubuntu include sample geodata; the separate source-code packages do not.[2] That last distinction matters: installing the calculation engine and obtaining a reconstruction are separate tasks.
Bring observations onto the globe
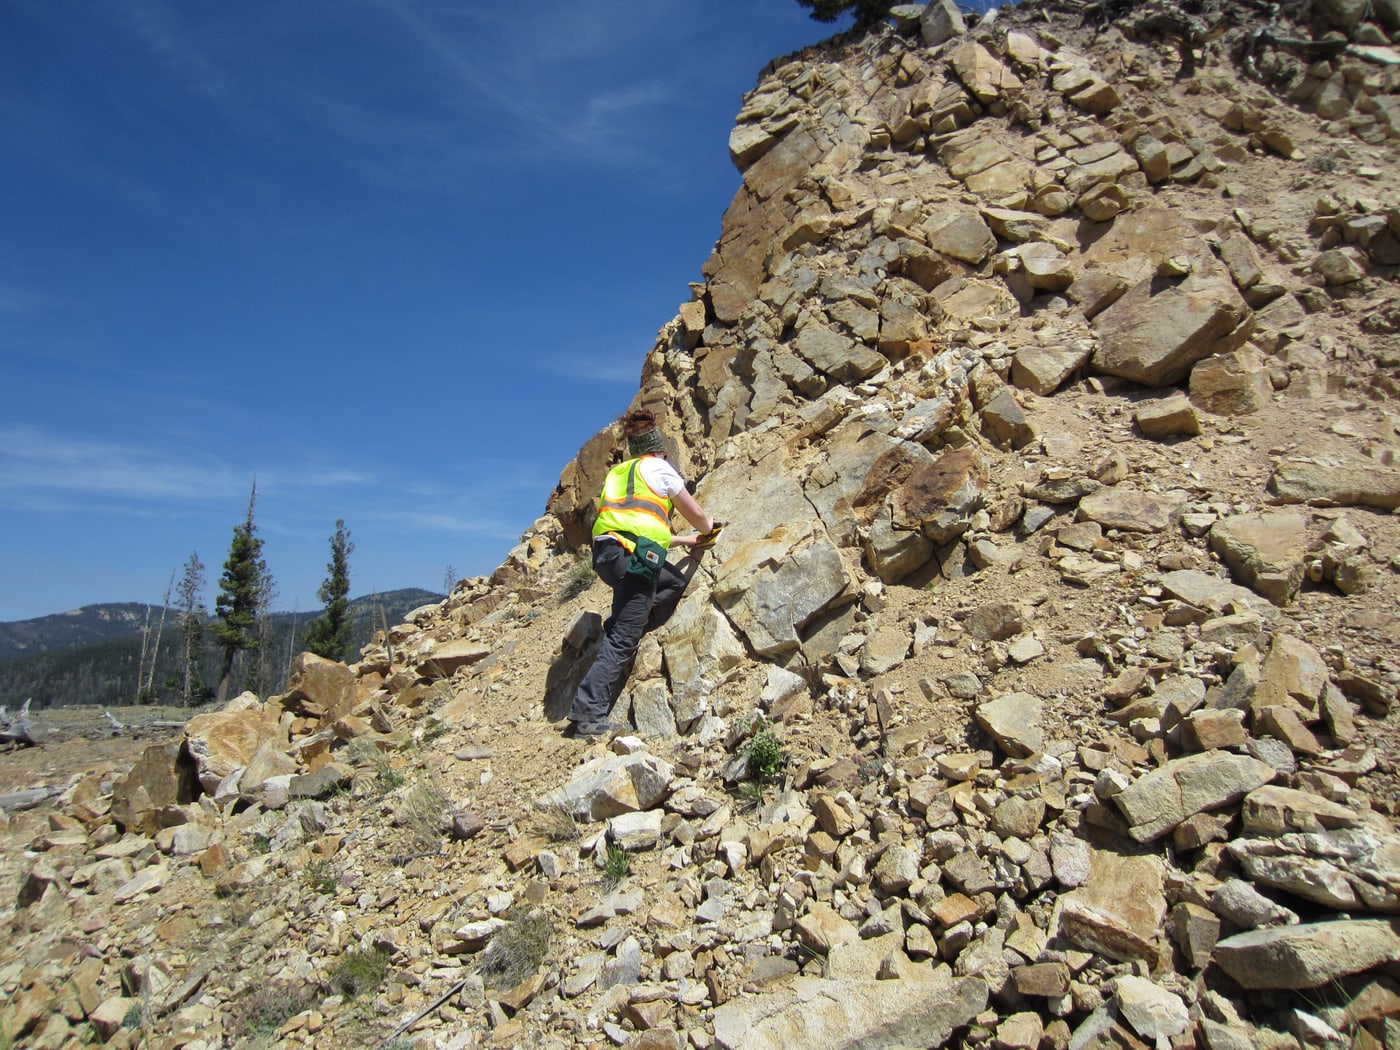
The photograph above shows a field geologist measuring rock orientation near Stibnite, Idaho.[9] It supplies a useful starting image for this software: someone has to observe the rocks before their history can become a moving globe.
A 2012 research paper by Simon Williams and colleagues explains GPlates through a problem familiar to anyone working with old geology. Observations that lie far apart today may have been close together when the relevant events occurred. The authors reconstruct geological regions, magnetic imagery, and paleomagnetic observations within alternative models of Rodinia and ancient Australia.[3]
The comparison is the revealing part. The same observations can be examined under different proposed arrangements. In the Australian example, changing the reconstruction changes how recognizable magnetic patterns line up. The software gives researchers a common setting in which to examine those consequences.[3]
That work can be lengthy even when its public presentation is spectacular. National Geographic's 2019 account of the Greater Adria research described a decade of collecting geological and geophysical material for a reconstruction using GPlates.[4] My reading of that reporting is that the moving map condenses a large human effort. Its smoothness tells us little about how difficult the underlying interpretation was.
What moves when you move the time slider
For a basic rigid reconstruction, a plate ID links a feature to its motion. Features sharing an ID move together. The model's creator assigns the numbers, which need not match familiar physical plates one-to-one.[5]
Rotations connect moving and fixed plate IDs at specified times. GPlates follows these relationships to an anchored ID, establishing a reference for the reconstruction. Time is expressed in Ma: millions of years before the present.[5]
Those choices give a reconstructed position its meaning. For a newcomer, identifying a feature's assigned motion and reference frame is a useful first achievement.
The software exposes the motion records through Features → Total Reconstruction Sequences. Expand a sequence to inspect its rotations and time range. GPlates also allows a sequence to be edited or disabled, making it possible to examine what a particular part of the model contributes.[6]
A first session with a question
Start with the supplied sample data and a narrow task: follow one region through a few times covered by its model. Write down the model's name and the feature you are following. Keep an untouched copy of the input files before exploring changes. This is a suggested learning exercise, rather than a claim that one sample reconstruction answers every geological question.
Then inspect the motion sequence associated with that region. Notice that applying an edit changes the loaded feature collection but does not save it to disk. The manual directs users to save that collection through Manage Feature Collections.[6] This is an ordinary software distinction with an unusually large visual consequence: a revised arrangement of continents can still be an unsaved experiment.
There is a second distinction when sharing the work. A .gproj project records the session, including layers and their settings, while feature collections hold the data. Unsaved feature collections must be saved before the project. The project refers to those files; it does not make their separate existence disappear.[7]
For a class or a small research group, I would therefore keep the project and its data in a deliberate folder structure, record their provenance, and test reopening the bundle on another machine. GPlates documents both relocation and missing-file recovery.[7] A screenshot cannot perform that handoff: the next person needs the materials that let them ask a different question.
When the question needs repeating
The Python library provides a path from interactive exploration to repeated calculation. The pygplates.reconstruct function takes reconstructable features, a rotation model, an output destination, and a reconstruction time; an anchor plate can also be specified. Output can go into a Python list or a file, including GeoJSON.[8]
That interface makes the dependencies unusually legible. A script still has to name the observations and the model. The API documentation also flags a practical export limitation: when writing a shapefile, source shapefile attributes are retained only when a single input feature collection is supplied.[8] Geometry arriving in an output file is only part of a successful transfer.
For someone comfortable with Python, repeating an already-understood reconstruction is a sensible next step. Scientific interpretation still calls for geological expertise, and a team needs someone responsible for model versions and input data. Automation can repeat an assumption just as faithfully as it repeats a calculation.
GPlates and pyGPlates are distributed under GPL version 2.[1] Their appeal here is concrete: a reader can progress from looking at a reconstruction to inspecting, changing, and sharing the ingredients that produced it. The interesting moment comes when the globe stops moving and someone asks why a particular piece is there.
Sources
- GPlates, official project website — desktop purpose, supported platforms, and GPL version 2 licensing; checked October 9, 2026.
- GPlates, “Download GPlates and Data” — stable releases, installation packages, and included sample data; checked October 9, 2026.
- Simon E. Williams and colleagues, “An open-source software environment for visualizing and refining plate tectonic reconstructions using high-resolution geological and geophysical data sets,” GSA Today, April/May 2012 — research examples and comparison of alternative reconstructions.
- Robin George Andrews, “Lost continent revealed in new reconstruction of geologic history,” National Geographic, September 11, 2019 — independent reporting on the research effort behind the Greater Adria reconstruction.
- GPlates User Manual, “Reconstructions” — plate IDs, finite rotations, anchored plate, rotation hierarchy, and geological time units.
- GPlates User Manual, “Total Reconstruction Sequences” — inspecting, editing, disabling, and saving motion sequences.
- GPlates User Manual, “Projects and Recent Sessions” — project files, separate feature collections, saving, and moving projects between computers.
- pyGPlates 1.0.0 documentation, “pygplates.reconstruct” — function inputs, output formats, and shapefile attribute limitations.
- U.S. Geological Survey, “Scientist Taking Strike/Dip Measurement,” July 29, 2013 — original institutional photograph of Shyla Hatch near Stibnite, Idaho; public domain.