The hard climb is over, but the question survives the ride home: was that effort better than last month's, or did it merely feel harder? GoldenCheetah gives that question a workspace. The open-source desktop application imports activity records, lets riders inspect individual efforts, and compares them with a larger history. Its appeal is the ability to move between the day's ride and the evidence behind a performance estimate.[1]
The project remains actively developed. Version 3.8, published on September 20, 2026, added a Plan View with calendars, an agenda, adherence tracking and training-load forecasts, alongside native Apple Silicon support. That makes this a useful moment to meet the software: its ambitions now stretch from recorded activity into planning, while the quality of the recorded history still deserves the first look.[2]
GoldenCheetah began with a more modest frustration. In 2006, Sean Rhea bought a PowerTap Pro and wanted to use it with his Mac without Virtual PC. Command-line tools for downloading and interpreting the data came first; a graphical application followed that September. The origin explains an enduring priority: riders should be able to work with their own measurements on their own computers.[3]
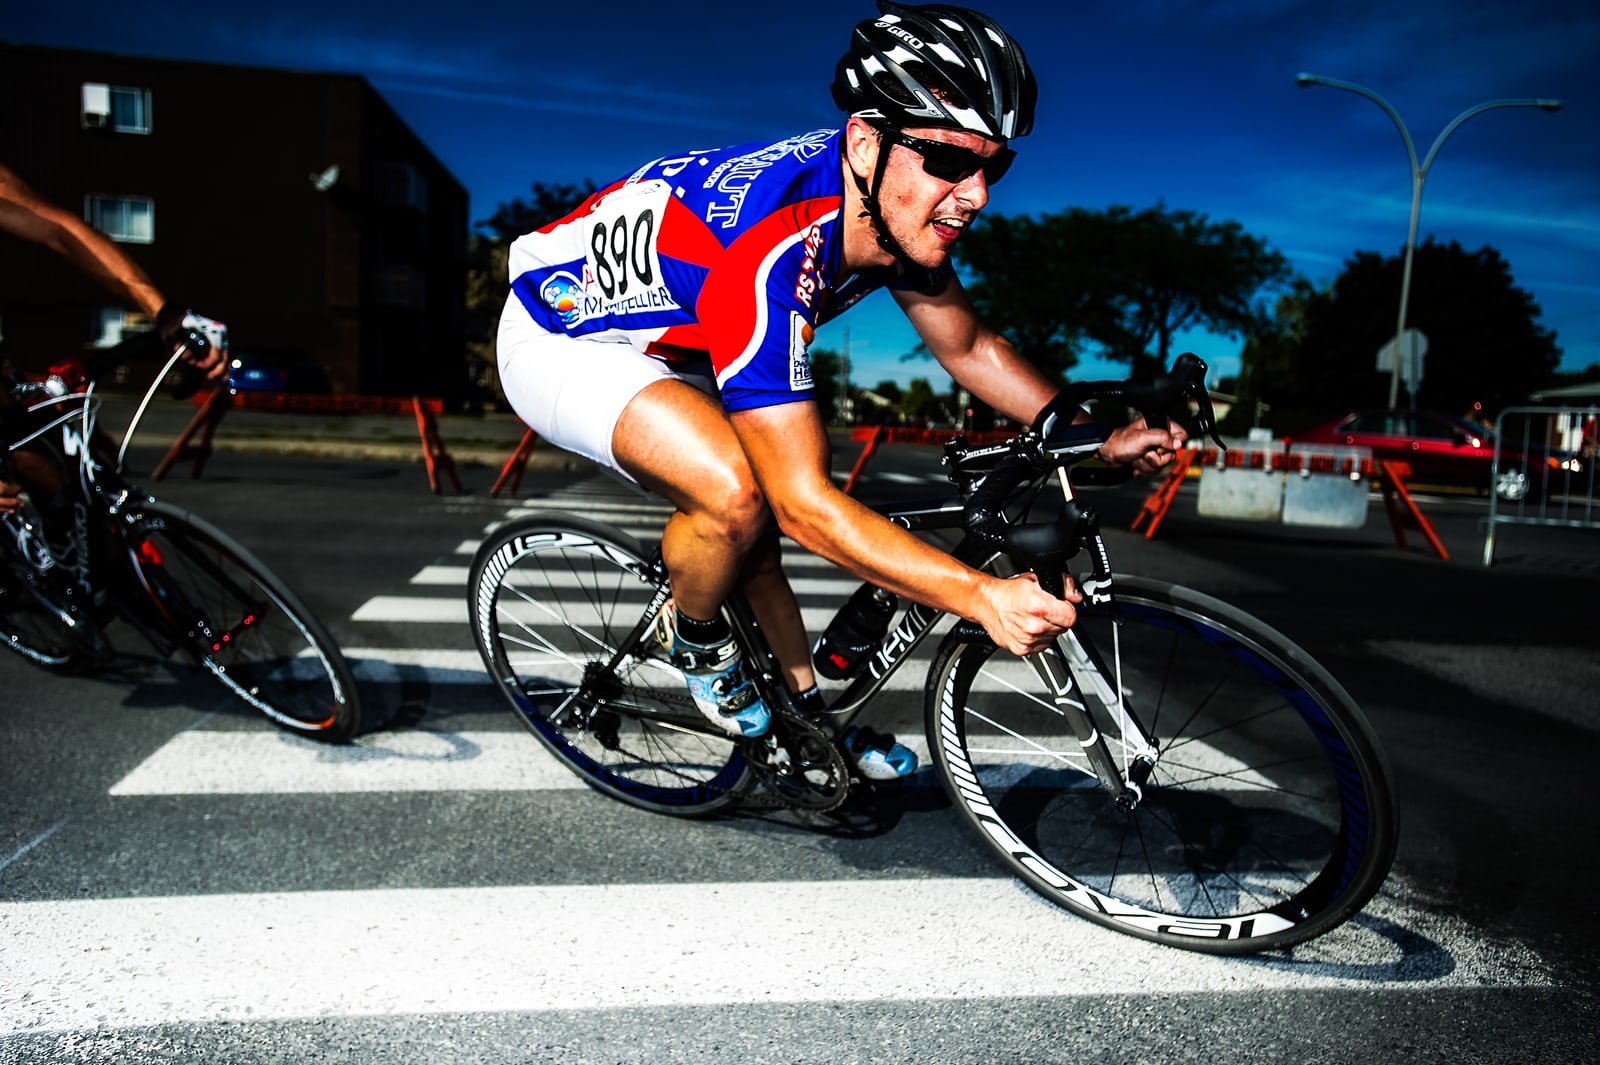
Today the project supplies builds for Windows, macOS and Linux under the GPL v2 license. It also supports user-defined metrics and charts, including Python and R integration. You do not need to write a model to benefit from that openness. A first investigation can begin with one familiar ride and a question small enough to answer.[1]
Suppose a rider has a recording containing a warm-up, a sustained climb and an easy return. Importing the file should preserve those distinctions. GoldenCheetah's import wizard checks that files can be read, validates them, and allows date corrections before saving. Files can be dragged from a local filesystem into the application. Its documentation also flags a concrete obstacle: GoldenCheetah is not MTP-aware, so some devices require copying their recordings onto the computer before import.[4]
That first step is worth doing with a ride you remember. Check its date and duration against the outing. Keep the original recording separately before experimenting with edits. These are small habits, but they leave you a reference when a later comparison looks surprising.
The Data chart exposes the recording as editable rows and columns. Its Anomalies tool can locate missing samples, suspicious readings and candidate power spikes; selecting a warning takes you to the relevant data. Undo and redo support inspection and correction.[5] For our imagined climb, an implausible brief peak deserves examination before it becomes a proud personal best. An anomaly flag identifies a place to investigate; it does not explain what happened on the road.
Next, give the climb boundaries. GoldenCheetah can import Garmin FIT laps as intervals, but a missed lap-button press need not erase the effort. Dragging across the Activity chart creates an interval; Find Intervals... can search by criteria such as peak power, ascent or time and distance. Save the activity to retain those intervals.[6]
The selection is an analytical decision. Including a minute of coasting after the summit changes the question from “how did the climb go?” to “how did the climb plus recovery go?” If last month's selection stops at the crest and today's runs into the descent, the comparison has already changed before any calculation begins. Naming the interval and checking its endpoints makes that choice visible.
A power-duration curve asks a different question. With Power selected, Show Bests plots the highest average power found for each duration in the selected recordings. The chart's date range and filters control which activities contribute. The Model tab can add a theoretical critical-power curve.[7] A five-minute best is therefore evidence from the selected recordings; a fitted value is an estimate. They can appear together without becoming the same kind of claim.
Imagine the rider spent the month doing steady outings and never attempted a hard five-minute effort. A lower recorded five-minute best than last season would establish what those files contain. It would not, by itself, establish a loss of ability. Equally, selecting an all-time history can retain a strong older effort that says little about this week's riding. The date selector is part of the meaning of the result.
GoldenCheetah's model documentation explicitly ties estimation quality to the performance tests supplied. Different models call for different combinations of maximal efforts; the CP3 model, for example, adds a maximal sprint to efforts lasting several minutes.[7] The software also lets users mark intervals as performance tests.[6] That label records a judgment about an effort. Applying it does not make an ordinary training interval maximal.
This is a demanding bargain. In its coverage of version 3.5, cycling publication road.cc described GoldenCheetah as best suited to people who already understand something about training with power, and emphasized its learning curve.[8] The project's own website acknowledges the same challenge.[3] The attraction is room to investigate; the cost is learning enough about the inputs and controls to make a comparison worth keeping.
For an individual rider, or a coach working with a small group, I would start with one athlete's local files and one repeatable comparison. Establish that the import is sensible, inspect an effort you recognize, and check the period behind the bests curve before adding forecasts. That is a manageable task for someone willing to maintain the files and learn the metrics. A collection of automatically imported rides, left unexamined, offers a weaker foundation.
The satisfying result is a traceable answer: this effort came from this ride, these endpoints define it, and these dates define its comparison. GoldenCheetah makes it possible to keep asking those questions as the training history grows. The climb ends on the road; understanding it can continue at the desk.
Sources
- GoldenCheetah, repository README — application scope, extensibility, supported desktop platforms and GPL v2 licensing; consulted November 7, 2026.
- GoldenCheetah, version 3.8 release (September 20, 2026) — Plan View, forecasting and native Apple Silicon support.
- GoldenCheetah, official homepage — Sean Rhea's 2006 project history, learning-curve discussion and cycling photograph credited to Justin Knotzke.
- GoldenCheetah User Guide, “First Steps: Download or import” — local-file import, validation, dates and MTP limitation.
- GoldenCheetah User Guide, “Chart Types: Activities” — Data chart, raw samples, anomaly detection and undo/redo.
- GoldenCheetah User Guide, “Side Bar: Activities view” — lap import, interval creation, saving and performance-test labels.
- GoldenCheetah User Guide, “Chart Types: Trends” — Critical Mean Maximal chart, date ranges, Show Bests and model requirements; consulted November 7, 2026.
- road.cc, “Best cycling training apps — get fit without getting bored” — independent discussion of GoldenCheetah 3.5 and its learning curve; used for historical reception, not current compatibility.