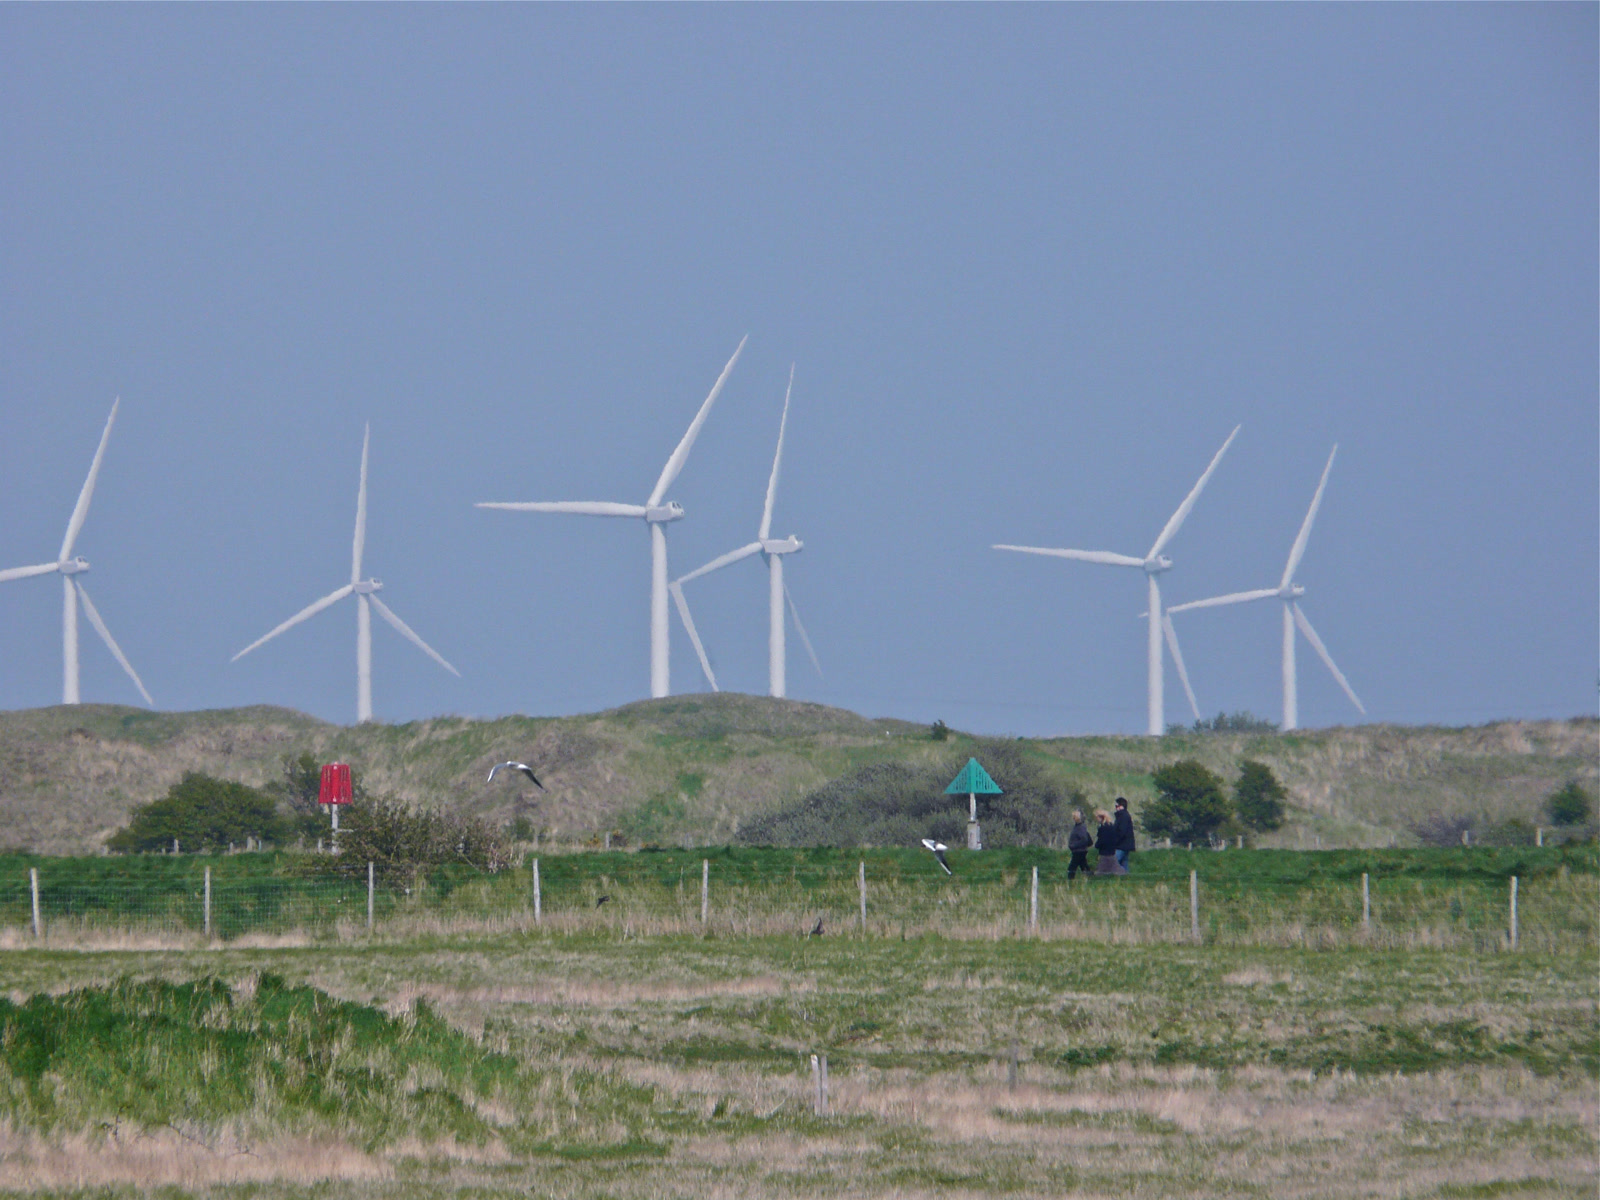
As of 2026-08-23 11:37 UTC, England's onshore-wind pipeline was moving again. Guardian analysis reported about 45 applications in the year to March, the highest annual count in a decade, and put proposed capacity entering planning at a 12-month rolling average of roughly 36 megawatts a month early this year—four times the rate before the July 2024 policy change.[1]
That is good news. It is also the wrong place to stop counting.
The official source complicates the precision of that headline. The Renewable Energy Planning Database lowered its inclusion threshold from 1MW to 150kW in 2021, so a raw application count across the decade is not fully like-for-like; pre-2021 projects below 1MW may be absent. The database is also a revisable snapshot rather than a frozen application ledger.[2] The direction of change is credible. The exact rolling-capacity calculation should remain attributed until its filters and treatment of revisions are published.
An application is evidence that a developer is willing to ask. It is not evidence that a planning authority has consented, a developer has financed, a network has connected, or a turbine has generated. England should treat the rebound as the first stage of a wind comeback and publish a quarterly, project-level scorecard showing how many megawatts reach every stage through operation.
This is not an argument for slowing approvals or dismissing a recovering pipeline. It is an argument for making the recovery falsifiable.
What is verified—and what it does not prove
| Signal | Record at the cutoff | Confidence and boundary |
|---|---|---|
| Applications revived | Guardian analysis of government data found about 45 English onshore-wind applications in the year to March. It reported that the rolling capacity rate rose from about 9MW a month before Labour took office to about 36MW a month early in 2026.[1] | High that the count and rate were reported; moderate as a comparable series. The public database's threshold changed in 2021, records can be revised, and the article does not publish a reproducible filter. Applications measure entry into planning, not delivery. |
| The pipeline is smaller than the headline count sounds | The same analysis calculated that proposals since the 2024 policy change totalled 438MW in England and 5,280MW in Scotland, with the English projects averaging two turbines and 8MW.[1] | Moderate pending methodology. These are publisher calculations from proposal records, not an official summary table. They do not predict attrition or support a direct England-versus-Scotland delivery forecast. |
| The official database already records stages | DESNZ's July 2026 Renewable Energy Planning Database tracks projects above 150kW from inception through planning, construction, operation and decommissioning. DESNZ says the snapshot is sourced mainly from the web and developers and invites corrections.[2] | High on scope, qualified on completeness and historical comparability. The threshold was 1MW before 2021. A lifecycle database makes cohort reporting possible; it does not by itself supply a simple conversion rate or guaranteed energisation date. |
| Britain's national build rate must accelerate | The Climate Change Committee says UK onshore-wind capacity reached 16.4GW in 2025 after 0.3GW was added that year. Reaching the government's 27–29GW Great Britain range requires average annual deployment of 2.1–2.5GW through 2030.[3][7] | High at national level. Great Britain and UK figures are not interchangeable with England-only applications. The comparison shows scale, not England's exact share of the remaining gap. |
| The national pipeline is not simply failing | The CCC rates onshore-wind operational capacity “on track,” citing 4.7GW contracted for delivery by 2030, while warning that sustained acceleration and further pipeline expansion are still required.[3] | High for the CCC assessment. A favourable national rating is the strongest counterweight to this opinion; it does not reveal which English applications will operate. |
| A connection offer is another gate, not the finish | NESO says the old connection queue exceeded 700GW. By June 10, network companies had issued offers to more than 700 ready-to-go projects representing 37GW across wind, solar, hydro and storage—58% of offers in the pre-2030 pipeline.[5][6] | High for the cross-technology programme. The published aggregate does not attribute all 37GW to onshore wind or prove that every offered project will commission. |
The boundaries prevent two equal and opposite mistakes. One is to say that 45 applications have changed power bills or energy security already. They have not. The other is to say that applications are meaningless because they are not turbines. They are meaningful evidence that a policy barrier was suppressing development interest and that developers have begun returning.[1][4]
The question is whether the public can see the next verbs: consented, financed, connected, built, operating.
The application surge is a release valve, not a result
England spent years with planning rules that gave onshore wind unusually restrictive treatment. The government removed the two special tests in July 2024 and later returned projects exceeding 100MW to the nationally significant infrastructure regime. Its onshore-wind strategy now contains more than 40 actions covering planning, aviation, radar, grid access, skills, supply chains and community benefits.[4]
The rebound therefore matters as a policy diagnostic. When a blocked route reopened, proposals rose. That is exactly what an early response should look like.
But the same strategy identifies why planning entry cannot be the final measure. A project can win local consent and wait for a viable connection. It can secure a connection and lack a bankable route to market. It can obtain a contract and encounter radar, supply-chain, construction or financing delays. Capacity can be revised between application and operation. A two-turbine scheme and a 100MW project each add one to an application count while contributing radically different amounts of power.[1][4][5]
Across the UK, the Taskforce estimates a four-to-nine-year path from inception to operation, says as many as 30% of submitted projects do not receive consent, and found that about 40% of projects consented in 2020 later expired. Those are not forecasts for the new English cohort; they show why stage conversion belongs in the public record.[4]
The July REPD release is designed to follow those transitions, yet the public story is still usually told as disconnected totals: applications this quarter, connection offers in another announcement, auction awards elsewhere, and operational capacity in a later statistics release.[2][3][6] A reader cannot reliably infer a conversion rate by placing those headlines side by side. Their dates, geographies, thresholds and project populations differ.
That measurement gap is where political credit arrives early and accountability arrives late.
The strongest counterargument: pipelines have to start somewhere
The fair objection is that this opinion demands proof before projects have had time to mature. The CCC reports typical delivery times of two to four years; the government's Taskforce strategy puts the full path from inception to operation at four to nine years.[3][4] Applications submitted after July 2024 cannot reasonably be judged as though they were all supposed to be operating by August 2026.
The national evidence is also stronger than a sceptical headline would suggest. The CCC's “on track” rating incorporates operating capacity and contracted projects, not merely planning submissions. NESO has replaced a first-come, first-served connection queue with a reordered pipeline intended to prioritise projects that are ready and strategically needed.[3][5][6] The government is not counting applications and doing nothing else.
That counterargument wins against any claim that England's wind revival is fake. It does not win against transparent cohort tracking. In fact, a two-to-four-year delivery lag makes the case for it stronger. If the public is told which quarter's proposed megawatts are awaiting decision, consented, contracted, connected, under construction or operating, nobody needs to pretend that an August application should become an August turbine. Progress can be judged at the correct stage.
Publish one pipeline, not another press release
The government does not need a new grand database. It needs a public view that joins the records it already maintains and states the limits of the join.[2][5]
For each quarterly application cohort, the scorecard should show:
- proposed megawatts and number of projects, kept as separate measures;
- megawatts approved, refused, withdrawn, revised, expired and still awaiting decision;
- median decision time and the age of the oldest unresolved applications;
- megawatts with a named route to market, including Contracts for Difference where applicable;
- connection status and offered connection year, with commercially sensitive details withheld only where necessary;
- megawatts under construction and operating, plus the time spent between each stage;
- original and revised capacity so that pipeline shrinkage is visible rather than silently overwritten.
The denominator must stay stable. A revised application should not appear as two independent projects. Repowering should be distinguished from wholly new capacity. England-only stages should not be compared casually with Great Britain targets. Projects below the REPD threshold should be labelled rather than allowed to disappear from interpretation.[2]
This would also improve local accountability. Councils could show whether decisions are slow because applications are incomplete, statutory consultees are delayed, community issues remain unresolved or staff capacity is thin. Developers could no longer describe every delay as “planning” when the binding constraint is a grid date or investment decision. NESO and network operators could show whether connection reform is advancing the same projects that planning policy unlocked.[4][5]
Decision impact: 24 hours, 7 days, 30 days
Next 24 hours — keep the headline in its lane. Ministers, developers and reporters should describe the 10-year high as an application rebound. It does not yet change operating capacity, bills or system reliability. The appropriate immediate claim is that development interest has responded to policy.[1]
Next 7 days — publish the definitions behind the claim. The Guardian should publish the exact filter used for the 45 applications and 438MW, including date window, treatment of revisions, technology threshold and status cutoff. DESNZ should publish an equivalent official cohort table. Together, those disclosures would let analysts test the result against the July REPD snapshot and explain later differences when records are revised.[1][2]
Next 30 days — set the cohort baseline. DESNZ, NESO and distribution networks should publish a crosswalk—or explain precisely why one cannot be published—between planning records, connection milestones and support contracts. A first scorecard can begin with aggregate cohorts if project-level matching requires more work. It should name an update schedule before the next quarterly REPD release, not after another favourable headline.[2][5][6]
Three conditional paths
These are observable branches, not probability estimates.
Base path — applications stay elevated, conversion is uneven. Smaller projects progress while some larger proposals wait on planning conditions, finance or connections. Trigger: the next two REPD releases show sustained submitted capacity but a slower, mixed movement into construction and operation.[2]
Upside path — the policy opening becomes a build cycle. Application cohorts advance through consent, secure credible connection dates and market support, and move visibly through the Taskforce's four-to-nine-year end-to-end window with credible construction and commissioning dates. Trigger: a rising share of each cohort's megawatts—not merely its project count—moves forward without equivalent growth in withdrawals, expiries or connection slippage.[4][5]
Downside path — the count masks attrition. Revised, withdrawn or refused projects remove much of the proposed capacity while viable schemes retain distant or uncertain grid dates. Trigger: headline application totals rise as net consented and construction-stage megawatts flatten, or offered connection years move beyond the delivery window.[2][5]
The accountability checklist
- DESNZ: add a stable quarterly cohort table to the REPD release and preserve prior snapshots so revisions can be audited.
- Planning authorities: report decision times, unresolved conditions and capacity outcomes, not just application counts.
- NESO and distribution networks: report how much onshore-wind capacity has reached each connection milestone and distinguish an offer from an energised connection.
- Developers: publish expected consent, investment, construction and energisation milestones and explain material slippage.
- Journalists and analysts: attach a stage, geography and cutoff date to every megawatt figure; never use “pipeline,” “contracted” and “operational” as synonyms.
I would withdraw the call for a new scorecard if the existing REPD, connection and contract registers can already be joined into a reproducible English project cohort with stable identifiers, historical stage changes and usable energisation dates. The central assessment should also be revised if later data show that application megawatts predict operating megawatts with a well-established lag and little material attrition, making an additional public view redundant.
For now, the application rebound deserves credit as a beginning. Government removed a barrier and developers responded. The honest way to defend that success is not to inflate it into delivered power. It is to keep counting until the megawatts reach the grid.
Sources
- Jillian Ambrose and Alex Clark, “Onshore windfarm applications hit 10-year high in England,” The Guardian (August 23, 2026) — current application analysis, England–Scotland comparison and project-size context.
- UK Department for Energy Security and Net Zero, “Renewable Energy Planning Database: quarterly extract” (updated August 3, 2026) — official July 2026 project-level snapshot, lifecycle stages, coverage threshold and data-quality caveat.
- Climate Change Committee, “Progress in reducing emissions: 2026 report to Parliament” (June 2026) — operating capacity, 2025 additions, contracted pipeline, annual deployment requirement, delivery times and on-track assessment.
- UK Department for Energy Security and Net Zero, “Onshore Wind Taskforce strategy” (July 4, 2025) — official planning history, delivery barriers and more than 40 actions across the development chain.
- National Energy System Operator, “Connections Reform Results” (updated February 2026) — old-queue scale, reordered-pipeline design, technology coverage and limits of the published connection snapshot.
- National Energy System Operator, “NESO and electricity networks issue offers to over half of energy projects needed by 2030” (June 10, 2026) — current aggregate on connection offers, project count, capacity and cross-technology scope.
- UK Department for Energy Security and Net Zero, “Clean Power 2030 Action Plan: A new era of clean electricity” (updated April 15, 2025) — 27–29GW Great Britain onshore-wind range and the wider planning, network and delivery framework.
- Jaminnun, “LittleCheyneWindFarmSussexUK.jpg,” Wikimedia Commons (April 19, 2009) — archival photograph of the operating Little Cheyne Court windfarm, licensed CC BY-SA 3.0.