Culture can earn more money without reaching more people. That distinction gives a statistical consultation an unusually practical stake: whether governments can recognise cultural growth that leaves part of the public behind.
As of 2026-10-17 19:33 UTC, the UNESCO Institute for Statistics’ published consultation window for its draft Cultural and Creative Ecosystem Indicators Framework has ended. It ran from September 23 to October 16. UIS says the feedback will inform further development ahead of a methodological manual planned for 2027. The document remains a proposal; the deadline does not establish that its indicators have been adopted or implemented.[1]
An audience is more than a sales total
The draft places cultural participation alongside economic measures, including employment and gross value added. Its proposed core participation indicator measures the share of people who attended, accessed or consumed cultural activities or content during the previous twelve months. Physical and digital channels are included; active creation is measured separately.[2]
That choice changes the question asked of a successful season. A theatre can sell more tickets to the same devoted audience. A participation measure asks how widely cultural activity reaches across the population. These are complementary accounts of success, and they can move in different directions.
The draft also proposes an income-related participation gap and separates indicators into three implementation tiers. Those tiers reflect feasibility and methodological maturity, rather than cultural importance. The distinction matters for agencies deciding where to begin: an easier measurement should not quietly become their definition of everything that counts. The proposal itself warns that its headline participation rate cannot establish quality, inclusiveness or outcomes.[2]
The people outside the average
Existing European statistics show how a wider view can work. Eurostat’s cultural-participation metadata describes household-survey results broken down by income group, education, age and other characteristics, including reasons for non-participation. It also separates cultural practices from internet use for cultural purposes.[3]
Consider a hypothetical city where overall participation rises while participation among lower-income residents falls. The average would support a celebratory announcement; the distribution would demand another question. Which residents joined in, and which were left further behind? Without the breakdown, a funder cannot distinguish those stories.
Nor does a gap explain itself. Survey information about reasons for staying away can guide further inquiry, but an observed income difference alone cannot tell a museum which opening hours, prices or activities to change. Measurement should make an intervention more specific, while leaving room to investigate the mechanism. That is the policy value of asking who is absent alongside how many people came.
A new framework cannot make an old survey current
The timing problem is equally concrete. Eurostat’s 2026 guide says cultural-participation questions were included in the 2022 quality-of-life module of its income and living conditions survey. The next such module is scheduled for 2028. The underlying survey runs annually, but this particular cultural evidence does not arrive every year.[4]
The same guide describes another boundary: the survey covers people in private households, with interviews conducted among those aged sixteen and over. People in institutions or collective households are generally excluded. A participation rate therefore describes a defined population, rather than every person who might benefit from cultural provision.[4]
For readers assessing a future national indicator, the practical questions are straightforward: when were people asked, who was eligible, and what activities did the questions cover? A new publication date does not refresh the observation period. Comparing two countries without checking those details could turn differences in survey design into apparent differences in cultural life.
Building the institutions that produce the numbers
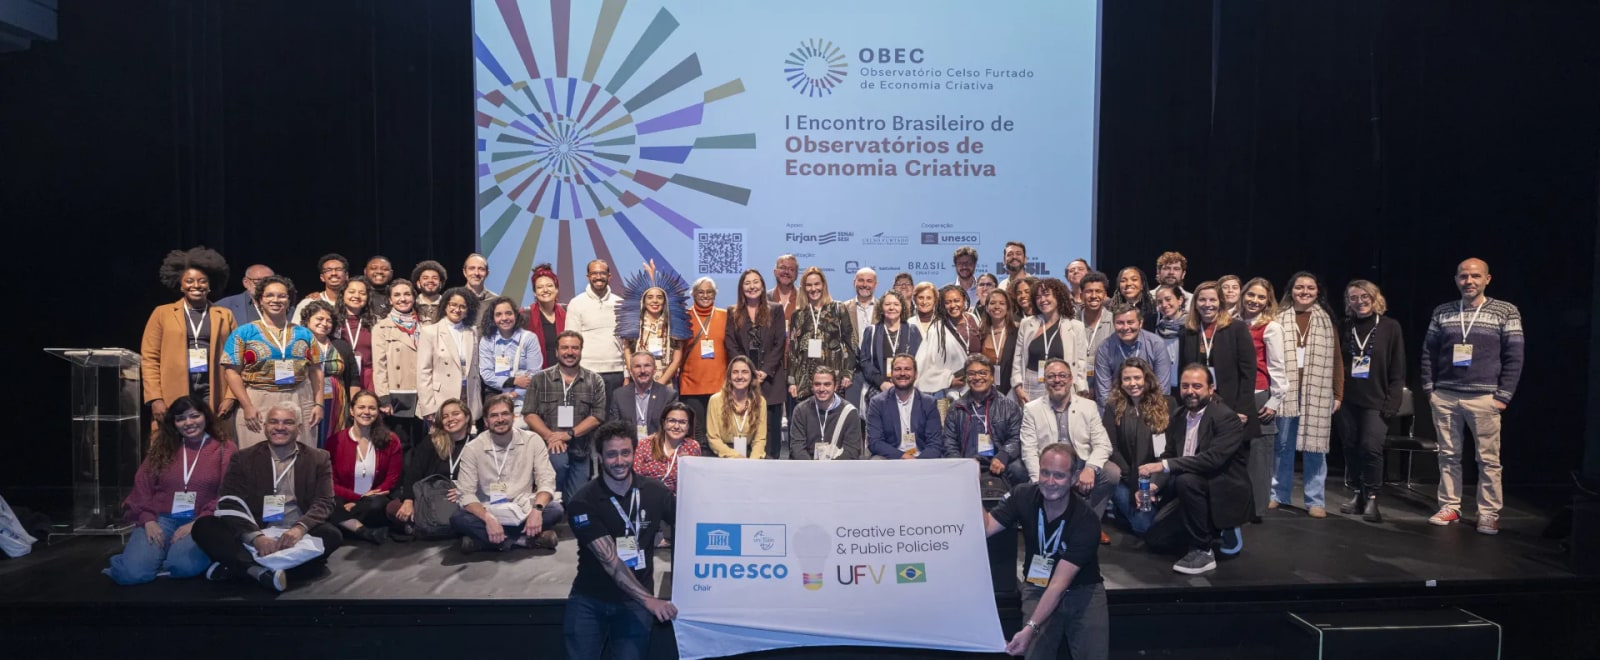
There is already work under way on the shared statistical language beneath the proposal. UNESCO reports that a May 18 meeting at Itaú Cultural in São Paulo launched both the Portuguese version of the 2025 Framework for Cultural Statistics and the Brazilian Network of Creative Economy Observatories. The gathering brought together researchers, public officials and institutions; the translated framework provides common concepts and classifications for producing comparable statistics.[5]
That is a useful example of the less visible part of measurement. Someone must connect an international definition to a local questionnaire, identify suitable records and preserve the knowledge needed to repeat the exercise. A network can create a setting for that work. Its launch alone does not demonstrate that every necessary dataset exists, or that different institutions now count the same activity consistently.
What would turn the proposal into useful evidence?
The following are conditional assessments, not announced outcomes. The base case is continued revision toward the planned manual, with published methodological changes as the next evidence of progress. The upside would be national trials that publish comparable results alongside coverage and uncertainty. The downside would be adoption of the vocabulary without repeatable data collection. Public survey instruments, release schedules and documented results would weaken that concern.
For cultural funders, practitioners and reporters following the work:
- Within 24 hours: identify the document as a consultation draft and check UIS for any revised timetable or status notice.
- Over seven days: examine whether proposed participation measures can be produced from existing surveys, with their dates and population limits visible.
- Over 30 days: look for a response to consultation feedback or concrete implementation plans. Reassess this account if UIS publishes a replacement draft, a final framework or a changed schedule.
The useful result would let a cultural organisation explain both what expanded and who took part—and make the limits of that explanation visible.
Sources
- UNESCO Institute for Statistics, “Shape the future of cultural and creative statistics: Global consultation now open,” September 23, 2026—consultation dates, draft status and planned 2027 manual.
- UNESCO Institute for Statistics, Cultural and Creative Ecosystem Indicators Framework, draft for consultation, September 2026—sections 6.7 and 7; participation, income gaps, economic measures and implementation tiers.
- Eurostat, “Cultural participation (cult_pcs)”—survey sources, population breakdowns, cultural practices and reasons for non-participation.
- Eurostat, Guide to Eurostat culture statistics, 2026 edition, chapter 8, pp. 64–67—survey frequency, reference periods and population coverage.
- UNESCO, “UNESCO launches, with partners, Portuguese version of the 2025 Framework for Cultural Statistics,” June 22, 2026, updated June 24—May 18 São Paulo launch, observatories network and photograph.