Most hypertension advice still treats home blood pressure monitoring as if measurement itself were treatment. The evidence points to a narrower and more actionable claim: home readings create outcome value when they trigger faster medication adjustment, better follow-up cadence, and fewer missed care transitions.
WHO now estimates 1.4 billion adults aged 30–79 live with hypertension, with only about 23% controlled.[1] That denominator explains why small average blood-pressure shifts matter. A 3–5 mmHg systolic reduction at population scale can move stroke and cardiovascular event curves materially over time. The mechanism question is therefore operational: what turns repeated home readings into lower pressure trajectories.
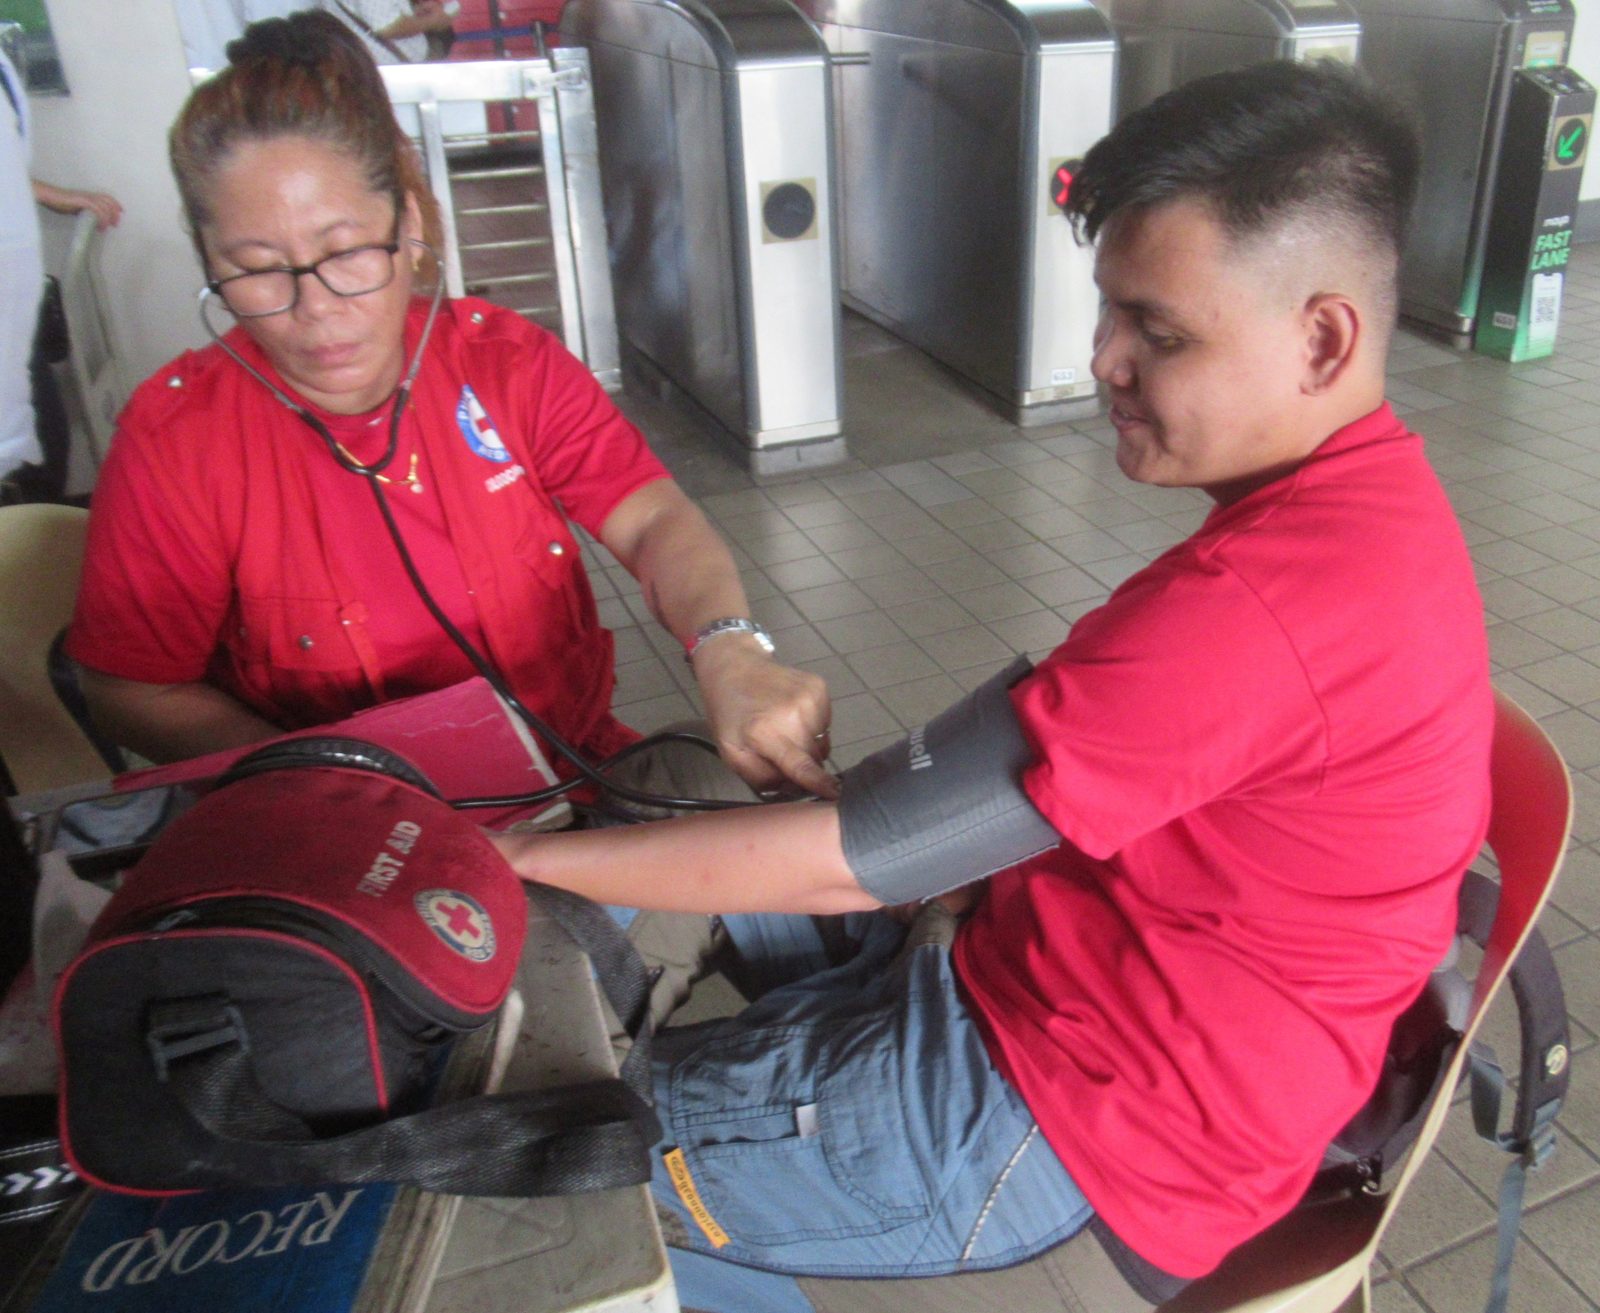
Image context: a real blood-pressure check in a community setting. It reflects the operational transition from one-off screening to repeated measurement and follow-up decision loops.
Mechanism chain: signal frequency to treatment intensity
A home cuff changes one property of care first: signal frequency.
- Clinic-only model: sparse readings, often months apart.
- Home model: repeated readings across weekdays, routines, and medication timing.
By itself, that higher signal density does not guarantee better outcomes. The mechanism closes only when three links hold:
- Valid measurement protocol (validated upper-arm device, seated rest, repeated readings).
- Interpretation and escalation rule (who reviews, at what threshold, on what timeline).
- Treatment action (dose uptitration, drug class add-on, adherence and side-effect management).
Without link 2 and link 3, programs accumulate data but not blood-pressure change.
Trial evidence: where the effect comes from
The TASMINH4 randomized trial in UK primary care (n=1,182) tested this directly: usual care vs self-monitoring vs self-monitoring plus telemonitoring under medication titration protocols.[2]
At 12 months, clinic systolic pressure was lower in both intervention arms versus usual care:
- Self-monitoring: adjusted difference -3.5 mmHg (95% CI -5.8 to -1.2)
- Telemonitoring: adjusted difference -4.7 mmHg (95% CI -7.0 to -2.4)
The key point is structural. The trial did not rely on passive self-tracking. It embedded readings into medication decisions by clinicians.
A broader individual-patient-data meta-analysis (25 trials; primary outcome data from 7,138 participants) found the same gradient pattern.[3]
- Overall effect at 12 months: clinic systolic -3.2 mmHg (95% CI -4.9 to -1.6)
- Self-monitoring alone: around -1.0 mmHg (crossing uncertainty bounds)
- Self-monitoring with intensive co-intervention: up to -6.1 mmHg (95% CI -9.0 to -3.2)
This is the central mechanism boundary for real-world deployment: monitoring intensity is less predictive than escalation intensity.
Digital workflows: what they add, what they do not
The HOME BP trial (n=622) tested a digital self-management pathway integrated with primary care and showed a one-year systolic difference of -3.4 mmHg (95% CI -6.1 to -0.8) versus usual care, with low incremental cost per mmHg reduction.[4]
Digital systems help with rhythm and routing:
- automatic capture,
- threshold-based alerts,
- structured medication review prompts.
But they do not remove core constraints:
- clinician response bandwidth,
- medication affordability and refill continuity,
- digital exclusion and language barriers.
Programs that ignore these constraints often produce “dashboard success” without denominator-level control gains.
Diagnostic boundary: home BP is also a confirmation tool
The USPSTF recommendation keeps a practical distinction: screen with office blood pressure, then confirm outside clinic before treatment initiation.[5] Home monitoring therefore has two jobs in the pathway:
- diagnostic confirmation and white-coat effect correction,
- longitudinal treatment steering after diagnosis.
Conflating these jobs is a common implementation error. A program can satisfy confirmation but still fail at control if medication intensification is delayed.
A 90-day implementation frame that matches evidence
For health systems or primary-care networks, the first 90 days are where outcome separation begins.
Days 0–14: protocol reliability
- Issue validated upper-arm cuffs and brief standardized training.
- Require a simple schedule (for example, morning/evening paired readings over 7 days before review).
- Define data acceptance rules upfront (minimum reading count, artifact handling).
Days 15–45: escalation discipline
- Review at fixed cadence rather than ad hoc inbox drift.
- Apply pre-agreed medication titration ladders when mean home BP remains above target.
- Track no-action events explicitly; unexplained non-intensification is a leading indicator of program failure.
Days 46–90: closure and equity checks
- Confirm refill completion and side-effect follow-up after each medication change.
- Flag participants with persistent uncontrolled BP for pharmacist/nurse outreach.
- Audit subgroup gaps (age, language, income, rural distance) so control gains are not concentrated only in digitally fluent populations.
The transfer lesson from trial evidence is straightforward: repeated readings are the input stream, not the intervention endpoint.
What is solid and what remains uncertain
Solid enough to implement now
- Home BP-supported care reduces systolic BP versus usual care when linked to treatment protocols.[2][3][4]
- Effect sizes are modest per person but meaningful at population scale.[1]
Still bounded by context
- Benefit size falls sharply when co-interventions are weak.[3]
- Operational load can shift from clinic visits to asynchronous review queues; staffing models decide whether this is net gain.
- Long-term persistence beyond trial support windows requires workflow ownership, not app adoption alone.
If there is one practical correction to keep, it is this: buy fewer assumptions, not just more cuffs.
Sources
- World Health Organization, Hypertension fact sheet (updated 2025, global burden and control metrics).
- McManus RJ, et al., The Lancet (2018) — TASMINH4 randomized trial of self-monitoring/telemonitoring for antihypertensive titration (PMID: 29499873).
- Tucker KL, et al., PLOS Medicine (2017) — Individual patient data meta-analysis of self-monitoring in hypertension (PMID: 28926573).
- McManus RJ, et al., BMJ (2021) — HOME BP digital self-management randomized trial (PMID: 33468518).
- U.S. Preventive Services Task Force (2021), Hypertension in Adults: Screening — recommendation to confirm diagnosis with out-of-office measurement.