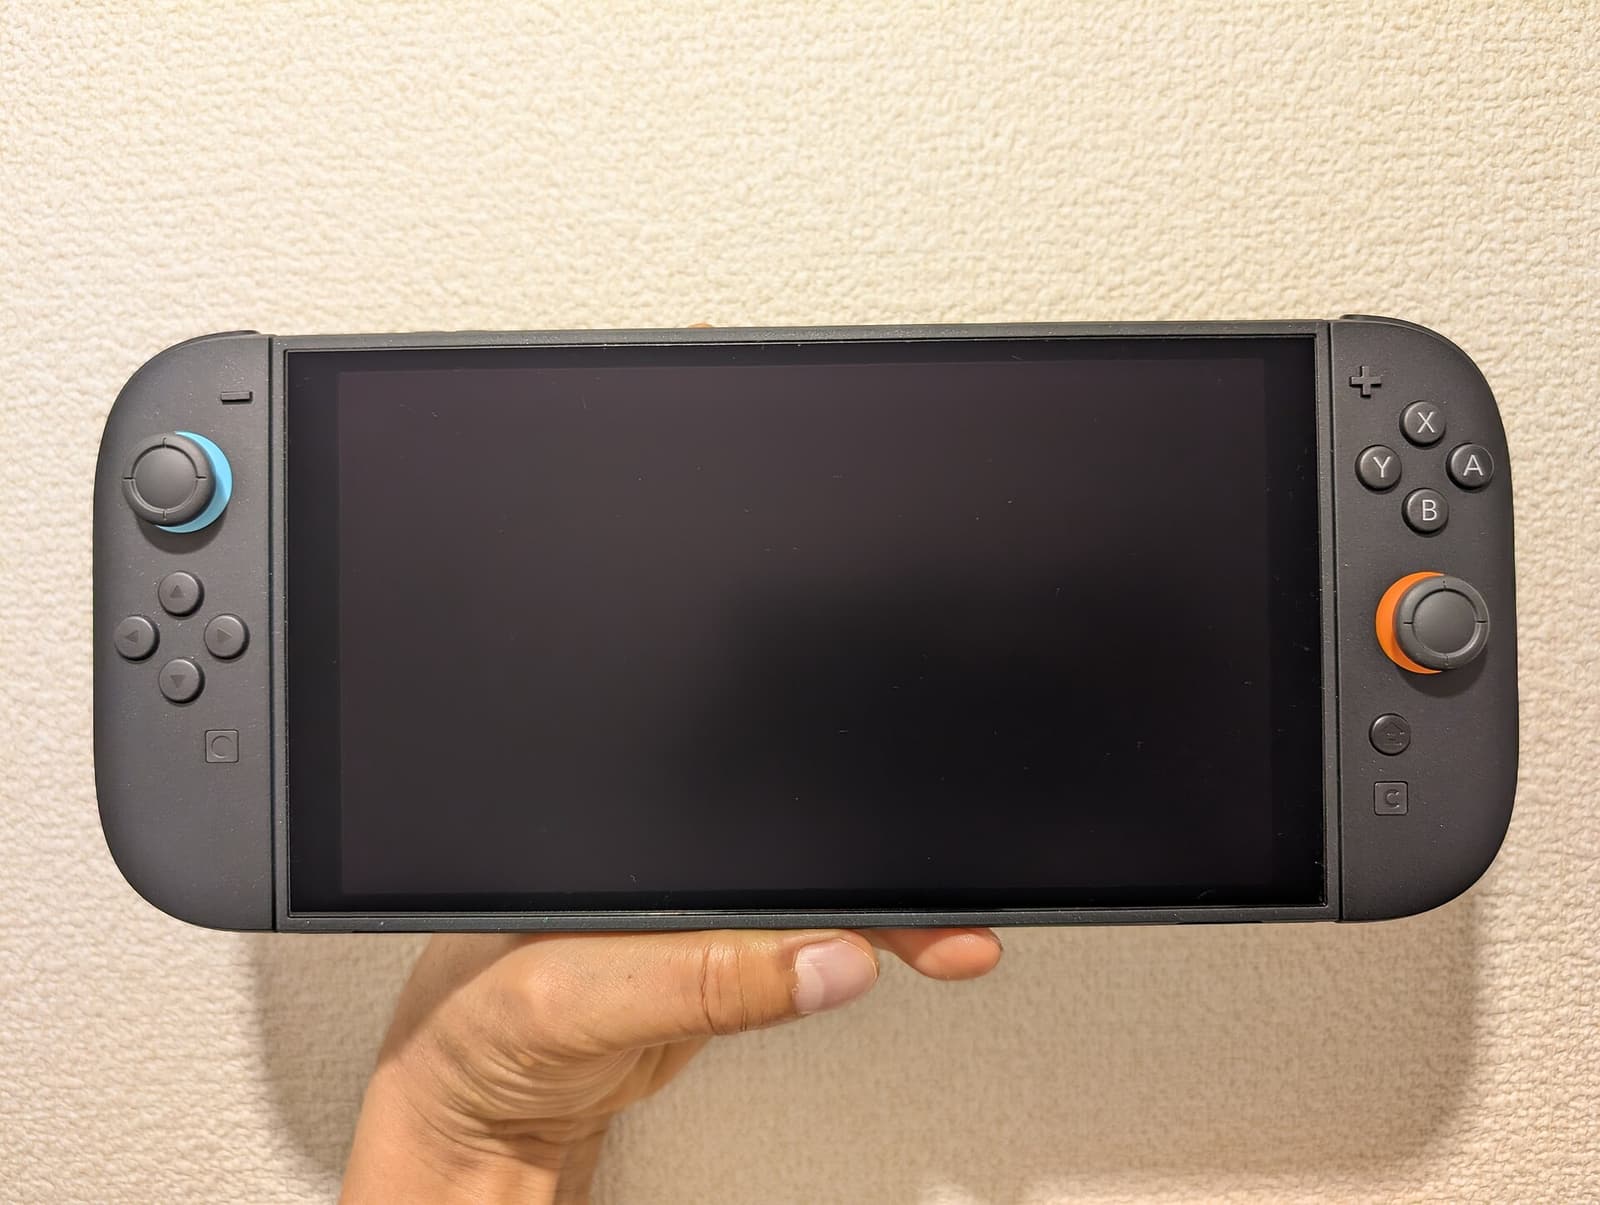
Nintendo closed on July 22 at ¥7,003, almost exactly 26 times management's ¥268.90 earnings-per-share forecast for the year ending March 2027. The record launch is no longer the surprise: Switch 2 sold 19.86 million units in its first fiscal year. The new burden is software—Nintendo expects 60 million Switch 2 games sold without bundles while hardware volume falls and component inflation plus tariffs remove roughly ¥100 billion from the economics.[1][2][3][4]
That is a demanding but coherent valuation. The share price does not require another launch-year hardware record. It does require Nintendo to turn a fast-installed base into paid software, wider operating margin, and less volatile earnings before investors stop awarding a premium multiple to the transition.
Freeze the denominator before telling the cycle story
The cleanest valuation uses the company's own forecast rather than trailing net income. Nintendo had about 1.153 billion shares outstanding excluding treasury stock on March 31. Applying the July 22 close gives an approximate equity value of ¥8.07 trillion; the share count is a March freeze point, not a claim about the exact intraday market capitalization in July.[1][2]
Nintendo forecasts ¥310 billion of profit attributable to owners for the current fiscal year, equivalent to ¥268.90 per share. Divide ¥7,003 by that guide and the result is 26.0 times earnings.[2] This is the useful anchor because last year's ¥424.1 billion net profit included ¥82.7 billion of equity-method profit, ¥44.3 billion of foreign-exchange gains, and a ¥32.6 billion gain on investment-security sales. Those lines were real, but treating all of them as recurring operating power would make the stock look cheaper for the wrong reason.[2]
The balance sheet supplies the strongest cushion. At March 31, Nintendo held ¥1.792 trillion of cash and deposits and ¥425.1 billion of securities, against ¥850.1 billion of total liabilities.[2] Not every yen is excess cash: a global hardware launch consumes inventory, supplier commitments, marketing, and working capital. Still, the liquid position means the valuation debate is mainly about the earnings multiple, not refinancing survival.
At 26 times the company guide, the market is already giving Nintendo credit for financial durability. It is not yet obvious that it is giving enough credit for a great software cycle—or that such a cycle will arrive.
The attach-rate headline understates the real hurdle
Switch 2's first fiscal year produced 19.86 million hardware units and 48.71 million software units.[3][6] A quick division gives 2.45 games per console, but that is not a clean paid attach rate. Nintendo says approximately 12.60 million of those software units were bundled with hardware or other products. Mario Kart World alone sold 14.70 million copies including bundles.[2][3]
Strip the disclosed bundles from the total and first-year unbundled software was roughly 36.11 million units. Nintendo's current-year forecast is 60 million units and explicitly excludes bundles. On that more comparable basis, the forecast asks unbundled software volume to rise about 66% even as hardware sales decline 16.9% to 16.5 million units.[3]
This accounting footnote changes the investment story. The easy reading is “hardware down, software up 23%,” using the reported 48.71 million base. The harder and more useful reading is that Nintendo intends to sell materially more standalone games into a larger installed base. That is precisely what a healthy second console year should do, but it transfers execution risk from factories and retail shelves to release cadence, game quality, third-party support, digital discovery, and player engagement.
The causal chain is short:
installed consoles -> desirable releases -> paid software units -> higher-margin mix -> earnings.
Backward compatibility helps the first link because Switch 2 can run much of the original Switch library, reducing the friction of moving to new hardware.[4][5] It does not guarantee the third. A player who spends another year inside an already-owned library is engaged, but that engagement does not automatically become current-year software revenue.
The margin guide has to absorb a hidden launch tax
Nintendo expects net sales to decline 11.4% to ¥2.05 trillion while operating profit rises 2.7% to ¥370 billion.[2] That moves the operating margin from 15.6% last year to roughly 18.0%. The forecast therefore contains a major mix-and-efficiency claim: fewer hardware units can still produce more operating profit if software contributes more, launch costs normalize, and the hardware margin does not deteriorate too sharply.
The counterforce is unusually concrete. Management says its forecast includes approximately ¥100 billion of pressure from higher component costs—especially memory—and tariffs. It describes the tariff estimate as an absolute cost, not merely a year-on-year increase, and expects component inflation to weigh progressively on hardware profitability.[4]
That creates a useful test. If Nintendo delivers the 18% operating margin despite the ¥100 billion drag, software and cost normalization are doing real work. If the company reaches its hardware target but misses operating profit, then units are disguising weaker console economics. The valuation belongs to the income statement, not the sell-through headline.
There is another boundary. Nintendo spent ¥177.9 billion on research and development and ¥144.7 billion on advertising in the launch year.[5] Investors should not assume every launch expense disappears; a durable platform needs a continuing stream of games, developer tools, network services, and marketing. The valuable normalization is not “spend less at any cost.” It is earning more gross profit per installed console than the ongoing content machine consumes.
What ¥7,003 implies
A three-point sensitivity makes the current burden visible. These are arithmetic cases, not target prices or consensus estimates:
- Downside — ¥5,280: ¥240 of EPS at 22 times. Software misses the unbundled ramp, the cost headwind persists, and the market treats Nintendo as a cyclical hardware publisher rather than a platform in expansion.
- Guide case — about ¥6,990: management's ¥268.90 EPS at 26 times. This is effectively the July 22 close and shows how closely spot already matches delivery of the current plan.
- Upside — ¥8,680: ¥310 of EPS at 28 times. Standalone software beats the forecast, operating margin clears the guide, and investors retain a premium for a longer, more profitable Switch 2 cycle.
The shape matters more than the endpoints. Merely meeting management's earnings guide does not create much rerating room if the multiple stays where it is. A meaningful upside case needs better fundamentals and continued multiple support. Conversely, the downside does not require Switch 2 to fail; a software shortfall plus ordinary multiple compression is enough.
The current price therefore reads as premium partly supported, with the next underwriting step still open. Nintendo has proved demand for the device. It has not yet reported the second-year software economics that the share price needs.
The strongest counterweight is the old platform, not the new box
The cautious view can overstate the cliff between generations. Original Switch lifetime sales reached 155.92 million consoles and 1.528 billion software units by March 2026.[6] Its catalog remains commercially alive, and Switch 2's compatibility lets Nintendo carry players, franchises, and development knowledge across the transition instead of rebuilding the audience from zero.[4][5]
That matters because hit creation is lumpy but franchise demand can persist for years. Mario Kart 8 Deluxe reached 71.08 million lifetime units on the original Switch, while Animal Crossing: New Horizons reached 49.91 million.[10] A larger active audience gives new releases more chances to compound, and the company's liquid balance sheet lets it fund those chances without depending on a friendly credit market.
The same evidence also limits exuberance. Mario Kart World's 14.70 million first-year total includes bundles, so it cannot be read as 14.70 million independent purchase decisions.[2][3] And 76.9% of FY2026 sales came from outside Japan, leaving reported earnings sensitive to currency assumptions; the current guide uses ¥150 per U.S. dollar and ¥175 per euro.[2] Nintendo owns unusually durable intellectual property, but the yen translation and the distinction between bundled adoption and paid demand still reach the valuation.
Falsifier
The “software still has to earn the multiple” view is falsified if Nintendo's August quarter shows all three links at once: unbundled Switch 2 software is running ahead of the 60 million-unit annual plan, operating margin is tracking above the 18% full-year guide despite component and tariff pressure, and management can lift the earnings path without relying on foreign-exchange or investment gains.[2][3][4][7]
That combination would show that the current 26-times multiple is attached to a rising earnings base rather than to hope left over from launch. Hardware sell-through alone does not falsify the view. The decisive evidence is paid software turning installed consoles into operating profit.
Watchlist
- August 6, 2026 — three-month earnings release: separate Switch 2 hardware from software, remove disclosed bundles where possible, and compare operating-profit progress with the full-year margin bridge. This is the first clean report on the console's second fiscal year.[3][7]
- September 1, 2026 — overseas hardware price increases: Switch 2's U.S. MSRP rises from $449.99 to $499.99, Canada's from C$629.99 to C$679.99, and the My Nintendo Store price in Europe from €469.99 to €499.99. Watch whether the higher ticket protects unit economics without breaking second-year sell-through.[8]
- March 31, 2027 — fiscal-year finish: require the 16.5 million hardware forecast, 60 million unbundled software forecast, and ¥370 billion operating-profit guide to reconcile as one economic result. A unit beat without the profit bridge is not the same thesis.[2][3]
Nintendo's launch did the expensive work of creating an audience quickly. At ¥7,003, however, investors are no longer being paid to discover that Switch 2 exists or that consumers wanted one. They are underwriting a quieter conversion: fewer new boxes, many more separately purchased games, and a margin that rises through a ¥100 billion cost headwind. The next level is made of software.
Sources
- Google Finance, “Nintendo Co Ltd (7974:TYO)” — ¥7,003 July 22, 2026 closing price used as the valuation freeze point.
- Nintendo Co., Ltd., Consolidated Financial Highlights and Results for the Fiscal Year Ended March 31, 2026 (May 8, 2026) — reported results, forecast, share count, balance sheet, dividend policy, geographic mix, and foreign-exchange assumptions.
- Nintendo Co., Ltd., Financial Results Explanatory Material: Fiscal Year Ended March 2026 (May 8, 2026) — hardware and software forecasts, reported units, bundle footnotes, and year-on-year comparisons.
- Nintendo Co., Ltd., Financial Results Briefing for Fiscal Year Ended March 2026: Q&A Summary (May 8, 2026) — second-year hardware assumptions, software's role in adoption, and the approximately ¥100 billion component-and-tariff cost estimate.
- Nintendo Co., Ltd., Annual Report 2026 — research and development, advertising, platform compatibility, operating risks, and franchise context.
- Nintendo Co., Ltd., “Dedicated Video Game Sales Units” (as of March 31, 2026) — lifetime Nintendo Switch and Nintendo Switch 2 hardware and software totals.
- Nintendo Co., Ltd., “IR Calendar” — August 6, 2026 three-month earnings-release date.
- Nintendo Co., Ltd., “Notice Regarding Price Revisions for Nintendo Products and Services” (May 8, 2026) — September 1 Switch 2 MSRP changes in the United States, Canada, and Europe.
- Masahiko Ohkubo, “Nintendo Switch 2” (June 7, 2025), via Wikimedia Commons — source page for the article's real product photograph.
- Nintendo Co., Ltd., “Top Selling Title Sales Units: Nintendo Switch” (as of March 31, 2026) — lifetime sales for Mario Kart 8 Deluxe and Animal Crossing: New Horizons.