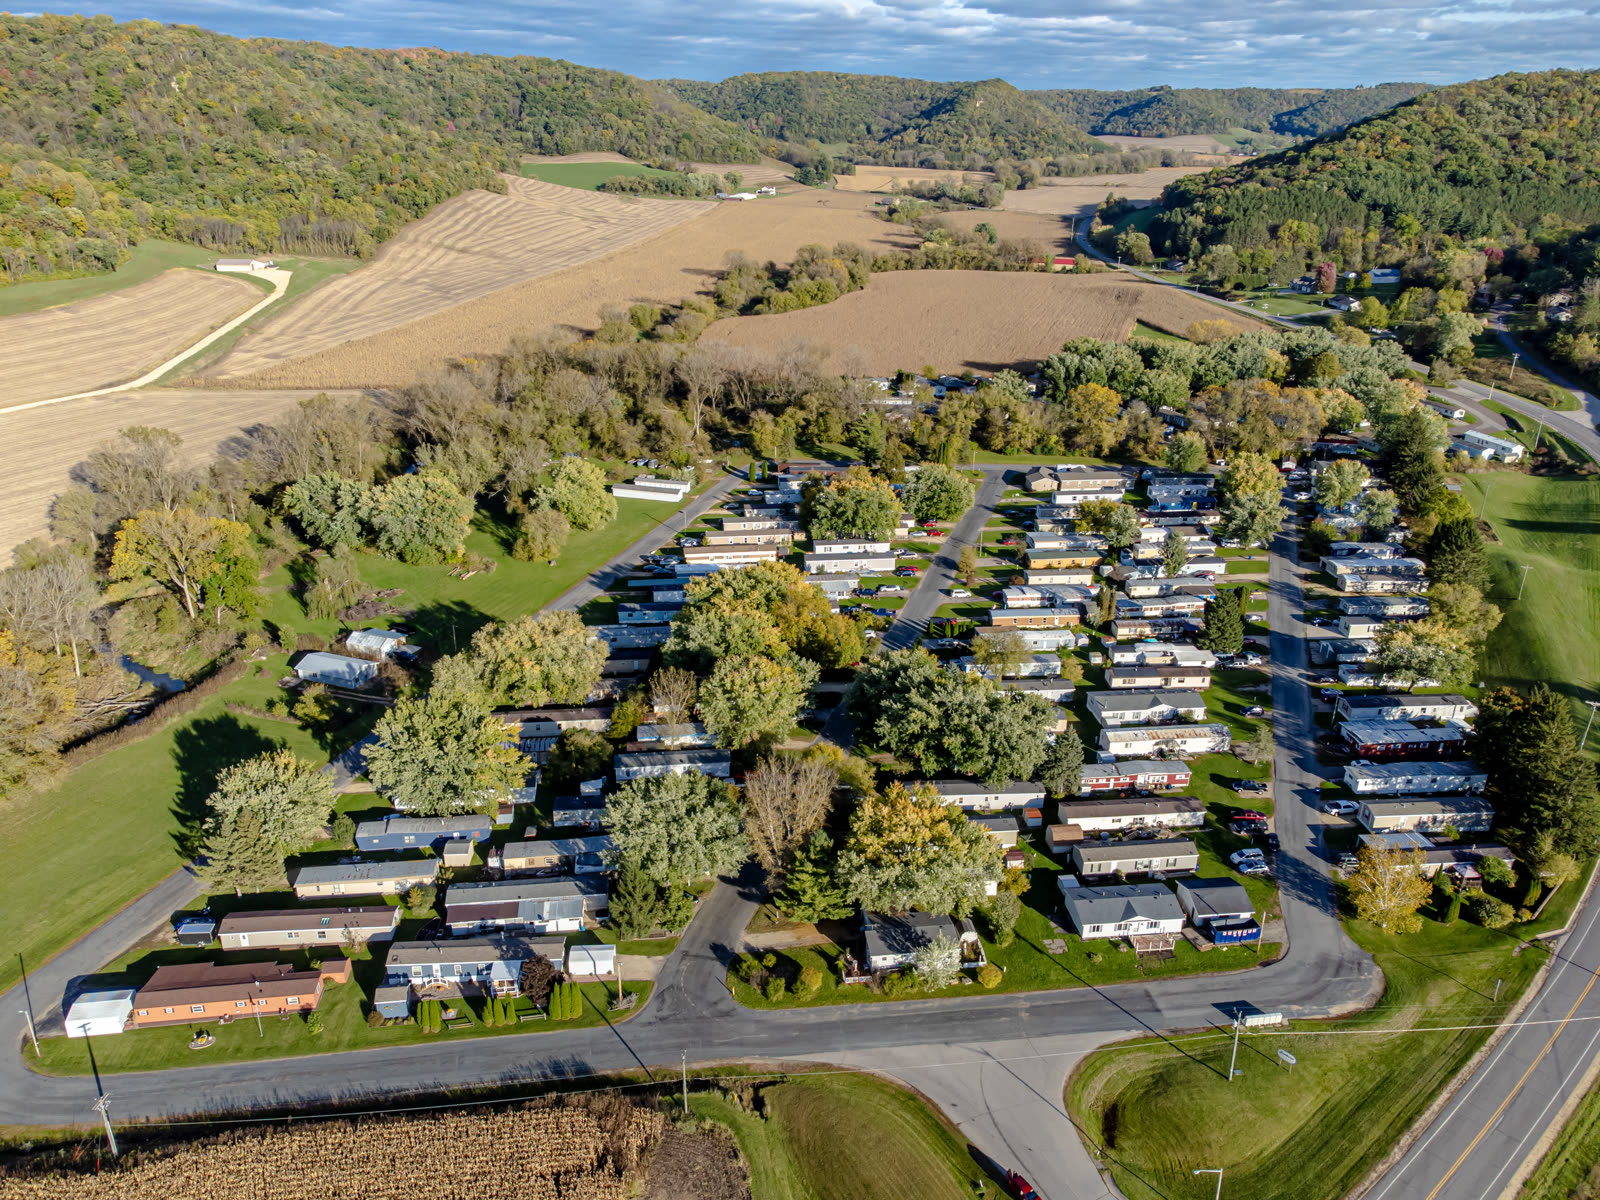
Priced: scarcity and sticky site rent are the familiar operating shorthand for manufactured-housing REITs. New: the latest filings reveal a spectrum of capital intensity. Even high-occupancy portfolios fund homes, while operators with more open pads make home placement and resident conversion a larger part of the growth algorithm.[1][2][3][5]
This is an operating comparison, not a claim that Sun Communities, Equity LifeStyle Properties, and UMH Properties trade at the same valuation multiple. The practical question is how much of the next dollar of growth comes from rent on an occupied site and how much must travel through inventory, installation, working capital, and financing before it reaches funds from operations per share.
The home and the site are different assets
A manufactured-home community combines assets that stock screens tend to collapse into one label. The operator owns the land, roads, utilities, and common areas. A resident may own the factory-built home and lease only the site, lease a home owned by the operator, or buy a home that the operator has placed for sale. Equity LifeStyle Properties describes its manufactured-housing sites as generally leased annually to residents who own or lease the homes on them.[2]
That creates a longer causal chain than “housing demand becomes rent”:
prepared site → financed or operator-funded home → installed home → resident occupancy → site and/or home rent → property NOI → FFO after interest and corporate costs
The financing step is not trivial. A 2021 Consumer Financial Protection Bureau study, based largely on 2019 Home Mortgage Disclosure Act data, estimated that around 42% of manufactured-home purchase loans were chattel loans secured by the home but not the land. The report found that chattel borrowers generally faced higher rates, higher denial rates, and fewer refinancing opportunities than manufactured-home mortgage borrowers.[6] That is historical structural evidence, not a live 2026 lending quote. It still explains why a community owner may need to finance, stock, sell, or rent homes to turn prepared land into occupied land.
Six numbers map the spectrum
Start with occupancy, while keeping the definitions visible. Sun reported 97.1% occupancy across its full manufactured-housing portfolio at March 31. Equity LifeStyle reported 93.8% average occupancy for its core manufactured-housing portfolio in the first quarter. UMH's preliminary July update put same-property occupancy at 89.4%.[1][2][5] These are not a standardized peer set: they mix period-end with quarterly average measures, and total, core, and same-property populations. They are a directional map, not a league table.
Now compare operator-home exposure. Sun's 12,800 rental homes were roughly 13% of its 100,830 manufactured-housing sites. Equity LifeStyle's 2,135 occupied rental sites were about 3% of its 73,170 ending core manufactured-housing sites. UMH's approximately 11,200 rental homes were roughly 41% of its 27,100 developed homesites.[1][2][5] The definitions again differ, but they expose strategy: Equity LifeStyle is relatively site-rent-heavy, Sun combines very high occupancy with a meaningful rental-home book, and UMH uses operator-owned homes much more extensively to convert sites.
The balance sheets reinforce that point. Sun disclosed $961.0 million invested in occupied rental homes and $132.8 million of manufactured-home inventory. Equity LifeStyle reported a $279.5 million gross cost basis for rental homes, while its Form 10-Q recorded a $14.3 million use of operating cash in “manufactured homes, net” and $22.0 million paid for home purchases during the quarter.[1][2][3] Home funding is not absent at the high-occupancy operators; its weight in the marginal growth plan is what changes.
UMH's 3,200 disclosed vacant sites are the clearest open-pad inventory in the group.[5] They are embedded capacity, but they produce no site rent until a home and resident arrive. That makes the sector a spectrum rather than a binary: rate, resident-owned-home placement, operator rental inventory, and vacant-site conversion can coexist inside the same REIT.
At high occupancy, rate carries more of the burden
Sun's first quarter shows why. Same-property manufactured-housing revenue grew 6.6%, expenses grew 7.8%, and NOI grew 6.3%; management guided to 5.7%–6.7% manufactured-housing same-property NOI growth for 2026.[1] With manufactured-housing occupancy already high, the immediate sensitivity is whether rent and utility recovery stay ahead of labor, insurance, repairs, taxes, and other property costs.
Yet “high occupancy” does not mean “home-light.” Sun's rental-home investment grew 18.3% from a year earlier.[1] A full community can still add or replace company-owned homes, carry sale inventory, expand sites, and allocate capital to acquisitions or repurchases. The narrower claim is that existing-site rent can do more of the near-term earnings work when fewer pads are empty.
Equity LifeStyle is the intermediate case and a warning against mixing cash use with earnings expense. Core manufactured-housing base rental income rose 5.7%, but RV and marina base rent declined 1.4%; interest and related amortization increased to $33.6 million from $31.1 million; general and administrative expense increased to $11.1 million from $9.2 million; and equity in joint-venture results moved from $4.9 million of income to a $0.9 million loss.[2][3] Those disclosed offsets—not the $14.3 million home working-capital use—help explain why consolidated normalized FFO per share rose only 0.3%. Home purchases consume cash, but they do not directly reduce normalized FFO when made.
An open pad creates leverage—and a funding bill
UMH's current operating plan makes the other model unusually visible. In the second quarter, it said it rented 193 new rental homes, lifted net rental-home occupancy by 139 units, had 100 homes on site ready for occupancy, and had another 300 being set up.[5] Each stage sits at a different point in the conversion chain. A home in transit, a home awaiting installation, and an occupied rental home may all support the same long-term thesis, but only the last one is producing rent.
The first-quarter financials show both sides. UMH moved 142 new homes from inventory into revenue-generating rentals, increased same-property occupancy by 110 basis points year over year, and grew same-property NOI 7.1% to $34.9 million. Normalized FFO dollars rose 2.8% to $19.4 million, but diluted weighted-average shares rose 2.4%, leaving normalized FFO per share rounded at $0.23 in both periods. Management also said interest expense had increased substantially after refinancings and a new bond issue, and noted that interest on completed lots and added rental units is expensed once those assets are complete.[4]
That is the bridge investors need to audit, without pretending the home purchase itself is an FFO charge. Property NOI, the cash cost of home inventory, interest expense, and share count run on different clocks. The return depends on how quickly each funded home becomes occupied, how long it stays occupied, whether incremental rent outruns financing and operating costs, and how much of the gain survives on a per-share basis.
National shipments are a feeder signal, not the moat
The Census Bureau's Manufactured Housing Survey reports national shipments, homes placed for residential use, dealer inventory, sales, and prices.[7] Those data describe the flow of factory-built homes. They do not measure whether a specific REIT has a prepared pad in the right community, whether a resident can finance a home, or whether the operator has already paid to place one.
That distinction prevents a common analytical shortcut. Rising shipments can improve the pool of homes available to occupy sites. Falling shipments can slow the funnel. Neither series is identical to community supply or site occupancy. A factory can ship a home without creating a new land-lease community, and an operator can fill a pad by moving an existing or company-owned home rather than waiting for a nationally reported retail sale.
Counterweight
The strongest counterweight is that vacant pads can be valuable, controllable growth inventory. UMH does not need to acquire another community to earn rent from a site it has already developed. Its July update showed rising occupancy, record quarterly home sales, and a larger pool of rental homes already on site or in setup.[5] If placements are fast and residents are durable, the upfront funding can produce attractive incremental NOI because much of the community infrastructure already exists.
Operator-owned rental homes can also solve the very financing friction that makes the fill engine look capital intensive. A resident who cannot obtain an attractive chattel loan may still rent. In that case, the REIT's balance sheet is not merely carrying inventory; it is supplying a product the consumer-finance market does not supply efficiently.[6]
The strongest challenge to a neat occupancy thesis is that Sun and Equity LifeStyle also fund homes, while Equity LifeStyle's operator-home exposure is lower than Sun's despite lower occupancy.[1][2] Capital intensity is a strategic choice as well as an occupancy outcome. A lower-occupancy operator that fills sites efficiently can outgrow a full operator, but a high-occupancy operator can still decide to expand its rental-home book. The question is not which model is inherently superior. It is whether each incremental home earns an adequate cash return and whether property growth crosses to the share level.
Falsifier
The thesis fails if UMH can fill a material share of its vacant-site pipeline and deliver sustained FFO-per-share growth without recurring increases in home working capital, debt, or preferred/common equity. That outcome would show that customer-funded placements, rapid inventory turns, or unusually strong rental economics make the open-pad option less capital hungry than the current operating evidence suggests.
It also fails as a peer framework if, after normalizing operator-owned homes and inventory by manufactured-housing site, capital intensity has no relationship to the marginal source of growth. Broader, cheaper consumer financing could produce that result by letting residents fund their own placements. So could equally aggressive home funding at Sun and Equity LifeStyle. The proof has to appear together in occupancy, home inventory, cash flow, financing, and per-share FFO—not in any one metric.
Watchlist
First, Equity LifeStyle is scheduled to release second-quarter results after the market closes on July 22, 2026.[8] Watch core manufactured-housing base-rent growth, home purchases, the “manufactured homes, net” cash-flow line, and whether the segment's strength reaches normalized FFO per share.
Second, Sun Communities is scheduled to report after the close on July 27, 2026.[9] The test is manufactured-housing NOI against the 5.7%–6.7% full-year guide, with special attention to occupancy and whether expense growth again runs ahead of revenue.
Third, UMH's final second-quarter results are due after the close on August 5, 2026.[5] Reconcile the July operational update with community NOI, normalized FFO per share, interest expense, home inventory, and any new financing. The high-quality result is not simply more occupied pads; it is more occupied pads with a credible per-share return on the capital used to fill them.
Manufactured-housing scarcity is an operating backdrop, not a complete earnings model. The occupied site is the income asset. The empty site is a growth option with an exercise price: a financed home, setup work, and a resident. The useful peer question is therefore not simply who owns the most sites, but who pays for the home that turns land into rent—and how much of that rent remains after cash funding, interest, and dilution.
Sources
- Sun Communities, “Sun Communities Reports 2026 First Quarter Results” (April 27, 2026) — occupancy, manufactured-housing same-property results, guidance, debt, and repurchases.
- Equity LifeStyle Properties, “ELS Reports First Quarter Results” (April 21, 2026) — manufactured-housing base rent, home sales, normalized FFO, portfolio mix, and site definitions.
- Equity LifeStyle Properties, Form 10-Q for the quarter ended March 31, 2026 — manufactured-home working-capital change, cash purchases, and operating cash flow.
- UMH Properties, “UMH Properties, Inc. Reports Results for the First Quarter Ended March 31, 2026” (April 30, 2026) — occupancy, rental-home conversions, same-property NOI, FFO, and interest-expense commentary.
- UMH Properties, “UMH Properties, Inc. Second Quarter 2026 Operations Update” (July 2, 2026) — preliminary occupancy, home placements, vacant sites, financing activity, and the August reporting date.
- Consumer Financial Protection Bureau, “Manufactured Housing Finance: New Insights from the Home Mortgage Disclosure Act” (May 27, 2021) — chattel-loan prevalence and borrower financing frictions in the report's historical data.
- U.S. Census Bureau, “Manufactured Housing Survey: Latest Data” — monthly shipment, placement, inventory, sales, and price tables.
- Equity LifeStyle Properties, “Equity LifeStyle Properties, Inc. Announces Second Quarter 2026 Earnings Release and Conference Call” (July 13, 2026) — July 22 release timing.
- Sun Communities, “Sun Communities, Inc. Announces Date for Second Quarter 2026 Earnings Release and Conference Call” (July 20, 2026) — July 27 release timing.
- Wikimedia Commons, “File:Mobile home park.jpg” (photographed October 15, 2023) — Wikideas1's CC0 aerial photograph used as the article image.