Priced: Kroger's sales warning is plain. Second-quarter identical sales excluding fuel rose just 0.2%, and management cut the full-year range from 1.0%-2.0% to 0.2%-0.8%.[1][2] New: the company left its $5.0-$5.2 billion adjusted FIFO operating-profit guide untouched. Its explanation is that lower pharmacy prices are shrinking reported sales without shrinking profit.[1]
That mechanism is plausible, but it is not the whole quarter. Kroger also reported softer grocery units, a smaller basket, and adjusted operating profit that declined year over year. Pharmacy can reconcile part of the sales-profit split; it cannot turn the remaining retail weakness into a statistical illusion.
Evidence cut-off: September 13, 2026, 18:45 UTC. The comparison bar is Kroger's prior company guidance, not a live consensus estimate. Management commentary is attributed as such; percentage changes described as calculations are author-derived from company-reported unaudited figures. The adjusted guidance is non-GAAP, and Kroger says it cannot fully reconcile that outlook to GAAP without unreasonable effort because future adjustment items cannot be predicted. This is analysis, not investment advice.[1][2][3]
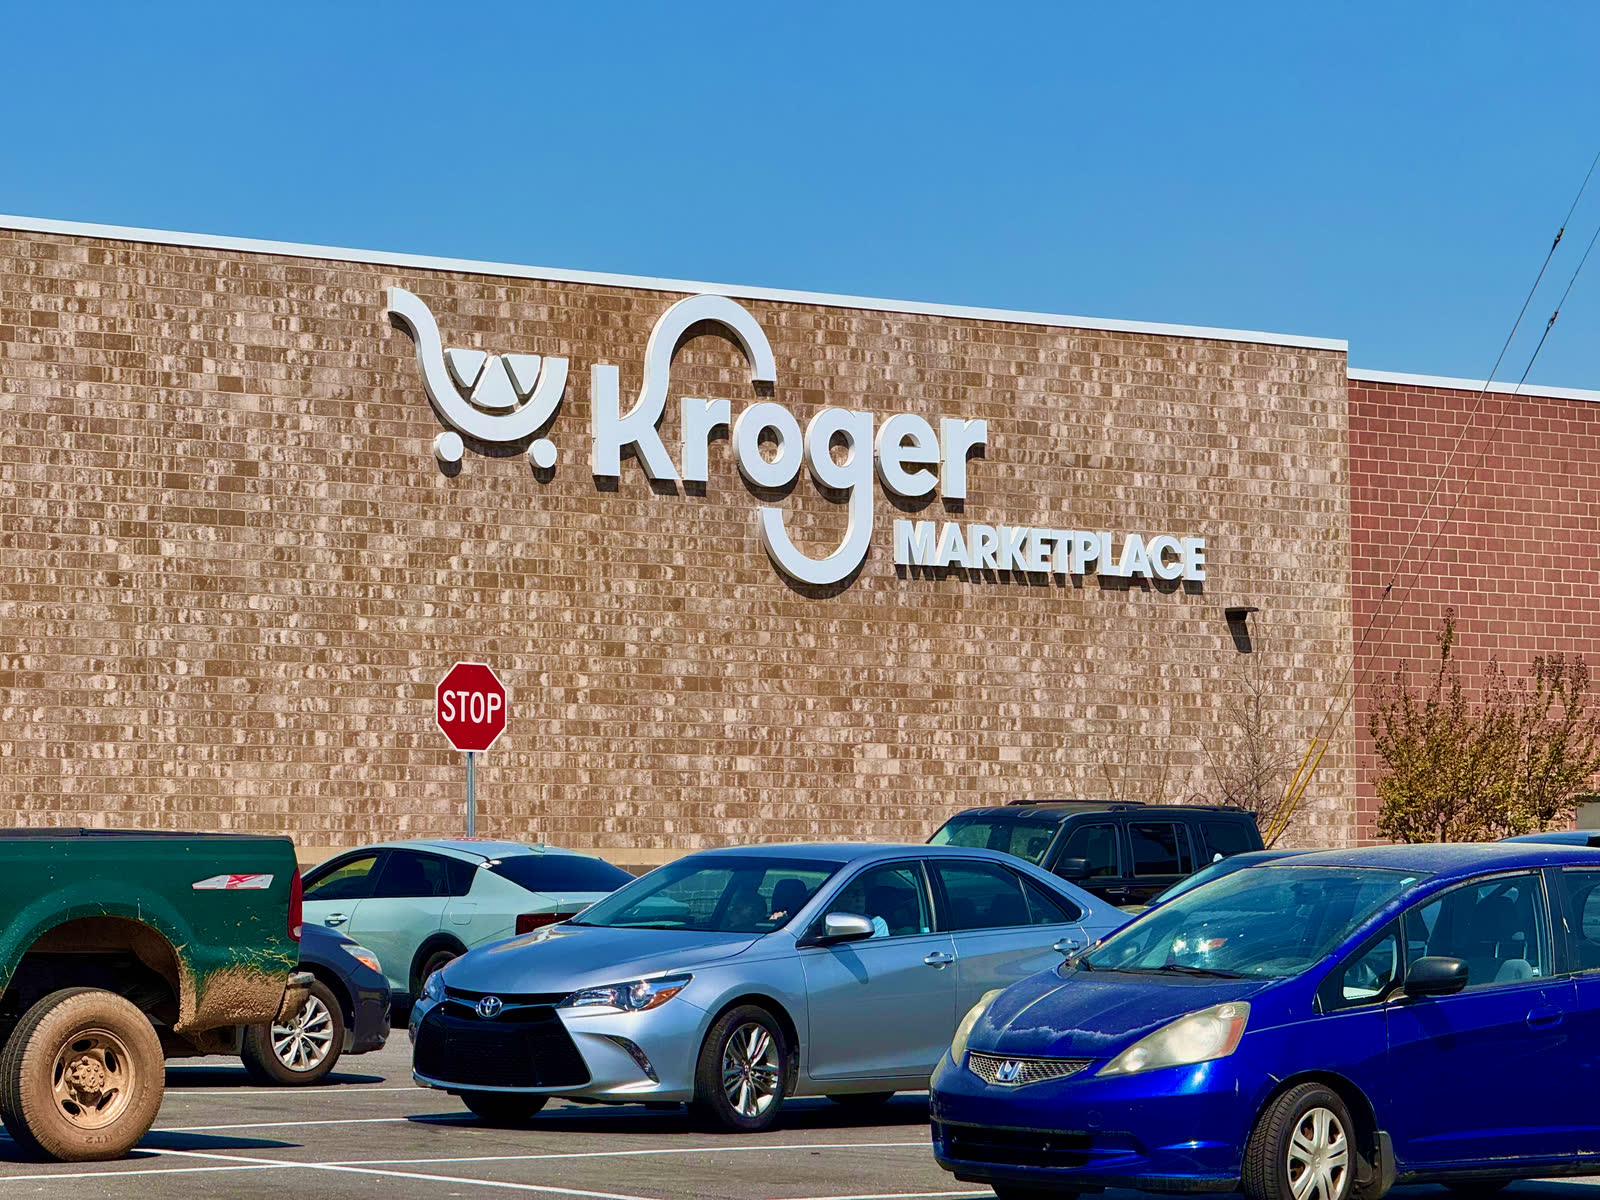
Image context: the cover is a documentary photograph of a Kroger Marketplace facade and parking lot in Athens, Georgia, taken in March 2026.[7] It does not depict a particular Q2 transaction. The building locates the physical system behind the earnings bridge: grocery aisles, a pharmacy counter, pickup operations, and shopper traffic gathered under one roof.[1][4]
One sales line, two kinds of economics
Six figures define the quarter: 0.2% identical-sales growth excluding fuel; a 138-basis-point drag that Kroger attributes to the Inflation Reduction Act; $1.076 billion of adjusted FIFO operating profit; $1.09 of adjusted EPS; $5.0-$5.2 billion of full-year adjusted FIFO operating-profit guidance; and a new 0.2%-0.8% full-year identical-sales range.[1]
The first two figures describe a revenue measure, not a volume or profit measure. Kroger's identical-sales calculation includes pharmacy sales at established stores.[1][4] If the price attached to a prescription falls, the sales numerator falls even when a customer still fills the prescription. Whether profit falls by the same amount depends on the drug's acquisition cost, reimbursement, mix, and the economics of the script—not on revenue alone.
There is an external policy clock behind the explanation. The Centers for Medicare & Medicaid Services says negotiated maximum fair prices for the first ten selected Medicare Part D drugs took effect on January 1, 2026.[5] Kroger attributes 138 basis points of its Q2 identical-sales result, and about 140 basis points of its full-year outlook, to the Inflation Reduction Act.[1] CMS confirms when the policy changed; it does not independently verify Kroger's company-specific sales or profit bridge.
This distinction explains how a retailer can lower its sales forecast while holding a profit forecast. It does not prove that Kroger will do so.
Do not “add back” the pharmacy headwinds
On the earnings call, management offered a fuller decomposition: roughly 140 basis points from Inflation Reduction Act effects, 60 basis points from a shift from branded to generic prescriptions, 35 basis points from the Cyclospora outbreak's effect on produce, and 30 basis points from egg deflation. Together, management called those items a 265-basis-point drag.[3]
It is tempting to add 265 basis points to the reported 0.2% and label the result “underlying growth.” That would manufacture a metric Kroger did not report. The components span different departments and mechanisms, may interact with mix, and do not establish what customers would have bought under different prices. Most importantly, management said grocery units decelerated slightly from Q1. In the question-and-answer session, CEO Greg Foran said traffic was up slightly but ticket was down, with fewer items in the basket.[3]
Those observations are management statements, not audited traffic data. Even so, they block the easy bull case. The pharmacy price effect may make the headline comp look worse than its profit consequence, while the grocery basket can still be genuinely soft. Both can be true.
The quarter did not produce clean profit growth
Kroger reported adjusted FIFO operating profit of $1.076 billion, down from $1.091 billion a year earlier—a calculated decline of about 1.4%.[1] Adjusted net earnings fell about 4.0%, to $667 million from $695 million. Yet adjusted EPS rose about 4.8%, to $1.09 from $1.04, because the diluted share count fell 8.6%, to 608 million from 665 million.[1]
That is not an accounting red flag by itself. GAAP EPS was $1.05, only four cents below adjusted EPS. The adjustment table identifies a gain on investments, litigation and settlement charges, and transformation costs; the net per-share adjustment was far smaller than the prior year's.[1] On the company's adjusted basis, however, Q2 EPS growth came from a shrinking denominator while adjusted earnings dollars declined.
The denominator will keep moving. Kroger repurchased $1.2 billion of shares in the first half and had about $800 million left under its authorization at quarter-end, which it expects to complete during fiscal 2026.[1] A buyback can be sensible capital allocation. It also means EPS alone is a weak test of whether pharmacy repricing is genuinely profit-neutral.
The operating bridge is visible, but incomplete
Kroger did show offsets below the sales line. Adjusted e-commerce sales grew 20%, and Kroger Precision Marketing profit grew 24%.[1] The adjusted FIFO gross-margin rate excluding fuel, rent, depreciation, and amortization improved 13 basis points. The comparable operating, general, and administrative expense rate moved the other way, increasing 33 basis points as wage, health-care, and sales-deleveraging pressure exceeded incentive-cost and productivity benefits.[1]
That mix fits the strategy described in Kroger's annual filing. Customer traffic and data support higher-margin businesses such as third-party media, whose earnings can help fund investment in the retail offer.[4] A lower-priced prescription can therefore depress a store's reported revenue while pharmacy mix, retail media, e-commerce economics, sourcing, and cost savings support consolidated profit.
But the release does not disclose a dollar bridge from the pharmacy revenue headwind to pharmacy gross profit, nor does it separately quantify the Q2 profit supplied by e-commerce and media. Management also declined to quantify its price investment on the call, saying more detail would come at the October investor update.[3] The mechanism is coherent; the proof remains aggregated.
The strongest counterweight
The strongest case for the unchanged profit guide is not the 0.2% comp by itself. It is the combination of a price-driven pharmacy headwind that management says has no profit impact, improved adjusted gross-margin rate, fast e-commerce growth, stronger retail-media profit, and cost savings that ran ahead of plan.[1][3] These are different profit pools from the grocery ticket, so consolidated earnings need not move one-for-one with identical sales.
The strongest counterweight is equally concrete. Adjusted operating profit and adjusted net earnings dollars already fell in Q2; grocery units decelerated; ticket declined; shrink and transportation costs rose; and expense-rate deleverage exceeded the reported gross-margin-rate improvement.[1][3] Management's “no profit impact” statement for the pharmacy headwind is still a claim without a disclosed pharmacy profit bridge.
Falsifier: reject the view that Kroger can preserve full-year profit through the sales reset if the next quarterly report shows another year-over-year decline in adjusted FIFO operating profit, continued weakness in grocery units or basket size, and no quantified e-commerce, media, or cost-savings offset.
The clean reading is neither “sales do not matter” nor “the guide cut exposes a broken model.” Pharmacy repricing gives Kroger a credible reason why some sales dollars carry little incremental profit. The next evidence must show that this narrow explanation can coexist with a healthier grocery basket—and that the profit guide survives on operating dollars, not only on fewer shares.
Four tests to watch
- October 20, 2026 — investor update. Kroger says it will provide longer-term financial targets and more detail on how cost savings fund customer value.[1][3] The useful disclosure is a measurable bridge: price investment, savings, e-commerce economics, media contribution, and the cadence of operating-margin improvement. Aspirational targets without that bridge do not close the Q2 evidence gap.
- The fiscal Q3 report — date not announced as of the evidence cut-off. Track adjusted FIFO operating profit and adjusted net earnings dollars before EPS, then grocery units, traffic, ticket, gross-margin rate, expense rate, and repurchase activity. This is the first direct test of the falsifier.
- January 1, 2027 — the next Medicare price step. CMS says negotiated prices for 15 additional Part D drugs take effect on that date.[6] Kroger expects its Inflation Reduction Act sales headwind to grow to roughly 150 basis points in Q4 and says it will still have no profit impact.[3] The policy date is known; the company-level outcome still has to be demonstrated.
- January 30, 2027 — Kroger's fiscal year-end. Kroger defines its year-end as the Saturday nearest January 31, making January 30 the 2026 fiscal close.[4] Compare the $5.0-$5.2 billion operating-profit target with the reduced sales range, and separate net-earnings delivery from the benefit of completing the remaining buyback.[1]
Sources
- The Kroger Co., “Kroger Reports Second Quarter 2026 Results and Updates Guidance for 2026,” unaudited Exhibit 99.1 furnished with Form 8-K/A (September 11, 2026) — results, reconciliation tables, guidance, operating drivers, capital allocation, and investor-update date.
- The Kroger Co., “Kroger Reports First Quarter 2026 Results,” unaudited Exhibit 99.1 furnished with Form 8-K (June 18, 2026) — the prior identical-sales, adjusted FIFO operating-profit, EPS, and free-cash-flow guidance baseline.
- The Kroger Co., Q2 2026 earnings-call transcript (September 11, 2026), via EarningsCalls.dev — management's pharmacy, grocery-unit, traffic, ticket, price-investment, cost-savings, and Q4 commentary.
- The Kroger Co., Annual Report on Form 10-K for the fiscal year ended January 31, 2026 — fiscal calendar and the retail-data, alternative-profit, and reinvestment model.
- Centers for Medicare & Medicaid Services, “Medicare Drug Price Negotiation Program: Negotiated Prices for Initial Price Applicability Year 2026” — the ten selected Part D drugs and January 1, 2026 effective date.
- Centers for Medicare & Medicaid Services, “Selected Drugs and Negotiated Prices” — the 15 additional Part D drugs whose negotiated prices take effect January 1, 2027.
- Harrison Keely, “The exterior of a Kroger Marketplace store in Athens, Georgia 01” (photographed March 22, 2026), Wikimedia Commons — source and CC BY 4.0 license for the documentary cover photograph.