Priced: by June, Dow had already raised its second-quarter operating EBITDA outlook by 10% to $2.2 billion as disrupted polyethylene and polyurethane supply improved pricing. New: the company delivered $2.312 billion, but the bridge underneath it was unusually narrow: local price rose 20% year over year while volume fell 1%.[1][3] This was a powerful demonstration of Dow's leverage to scarcity, not yet evidence of a broad demand recovery.
That distinction changes how to read the rebound. Net sales rose 20% to $12.092 billion, operating EBIT swung from a $21 million loss to a $1.648 billion profit, and operating EPS reached $1.44, against a $0.42 loss a year earlier. Yet the quarter did not pair better price with more product moving through the system. The next leg has to come from some combination of sustained price-cost spreads, genuine volume growth, self-help savings, and cleaner cash conversion.[1]
Evidence cut-off: August 2, 2026. “Operating” figures are Dow's non-GAAP measures; GAAP EPS was $0.99. This is an earnings readout, not a recommendation to buy or sell the shares.[1]
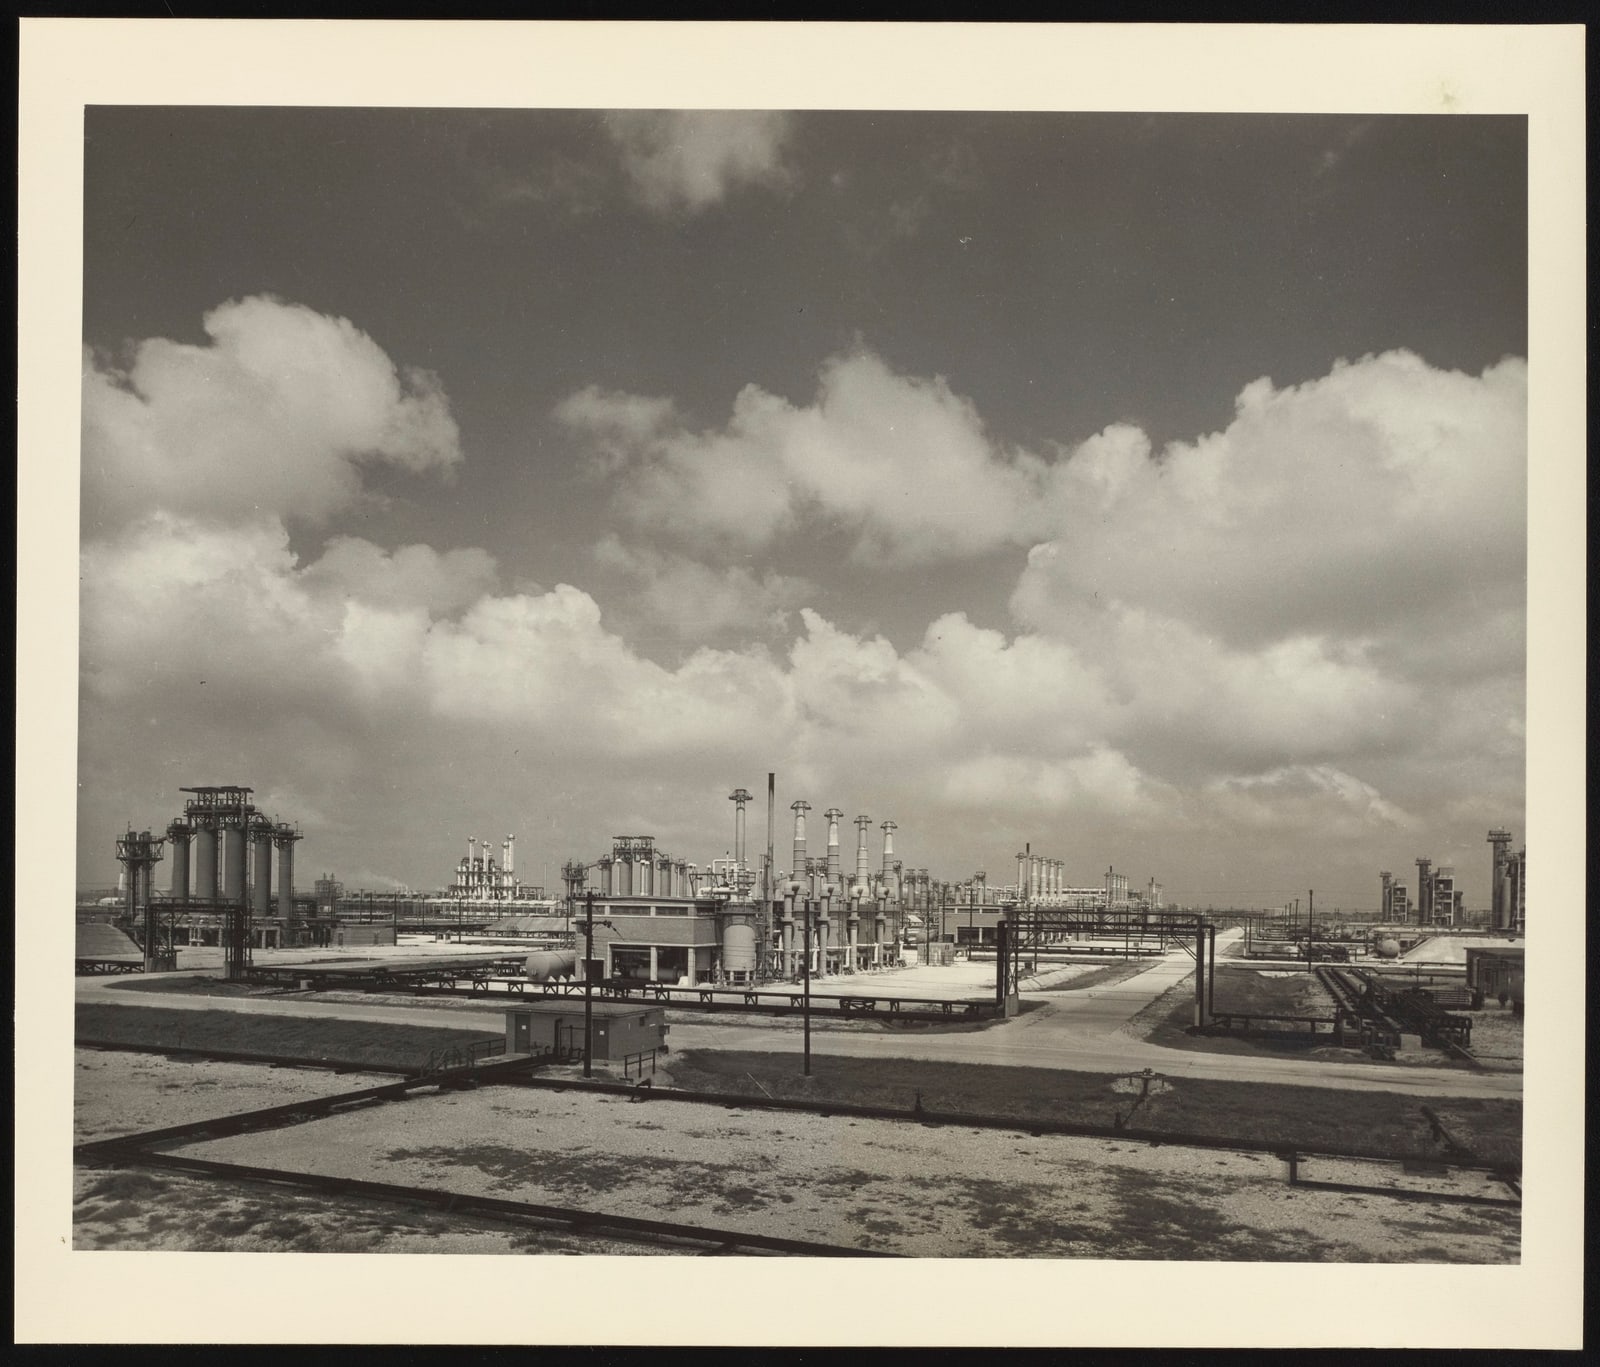
Image context: the cover is a 1952 photograph of Dow's Freeport, Texas, complex. It documents an earlier generation of chemical production rather than today's polyethylene assets. Its pipe racks, vessels, and towers are relevant because the quarter's financial result came from the economics of a physical, integrated manufacturing network—not from an abstract commodity-price ticker.[5]
The beat was concentrated in one engine
Packaging & Specialty Plastics supplied most of the change. Segment sales rose 27% to $6.385 billion, while operating EBIT increased by $1.207 billion to $1.278 billion. That single segment accounted for roughly 72% of Dow's $1.669 billion company-wide operating EBIT improvement, by calculation from the reported figures.[1]
The segment's own bridge is even clearer: local price rose 30%, currency added 1%, and volume fell 4%. Higher polyethylene prices expanded integrated margins, while planned maintenance and weaker volumes in Europe, the Middle East, Africa, India, and Asia-Pacific limited shipments. In other words, Dow earned much more on a smaller physical volume base.[1]
The mechanism began outside the income statement. Disruption in the Middle East constrained polyethylene supply and lifted industry margins, while Dow's North American ethane-based footprint remained comparatively advantaged. In April, management was already pointing to impaired transit through the Strait of Hormuz, announced global price increases, and a steeper petrochemical cost curve. By June, it had lifted Q2 EBITDA guidance from roughly $2.0 billion to $2.2 billion.[2][3]
The final $2.312 billion result therefore beat the original April frame by about $312 million, but only by about $112 million against the June update. The quarter was strong; much of the strength had become visible before the print.
Two other segments keep the diagnosis honest
Industrial Intermediates & Infrastructure also turned profitable. Sales rose 14% to $3.166 billion, local price increased 15%, volume declined 2%, and operating EBIT improved from a $185 million loss to a $246 million profit. Higher margins, self-help, lower maintenance, and the suspension of equity-loss recognition from Sadara all helped. That last item matters: not every dollar of the swing came from customers paying more for more material.[1]
Performance Materials & Coatings offered the inverse test. It was the only segment with clear volume growth—6%—and sales rose 11%, but operating EBIT fell $19 million to $133 million. Higher fixed costs, turnaround activity, and the shutdown of an upstream siloxanes plant more than absorbed the volume and self-help benefits.[1]
Together, the three segments separate price, demand, and execution:
- Packaging proved that a supply shock can create enormous operating leverage even when volumes contract.
- Industrial Intermediates proved that price and portfolio accounting can restore profit before demand does.
- Performance Materials proved that volume growth alone is insufficient when fixed-cost and shutdown burdens move the other way.
That is a more useful reading than calling the whole company either “recovered” or “still weak.” Dow had a very good earnings quarter, but its engines fired for different reasons.
Earnings reached cash, but not at the same speed
Cash flow is where a price-led recovery meets its balance-sheet cost. Dow generated $1.324 billion of operating cash from continuing operations and spent $632 million on capital expenditures, leaving $692 million of company-defined free cash flow. That comfortably covered the quarter's $253 million dividend, but operating cash equaled only 57.3% of operating EBITDA.[1]
The working-capital build explains much of the gap. From December 2025 to June 2026, trade receivables increased from $4.762 billion to $6.430 billion, while inventories rose from $6.595 billion to $7.233 billion. Some increase is mechanically consistent with higher selling prices and revenue. It is still cash that has not yet completed the trip back to the balance sheet.[1]
The quality test is therefore sequential, not merely year over year. Last year's comparison was depressed: Q2 2025 used $470 million of operating cash and produced negative $1.132 billion of free cash flow. Clearing that bar is meaningful. The harder task is to hold earnings while receivables are collected, inventory normalizes, and restructuring cash costs continue.
The strongest counterweight is that scarcity may not be fleeting
The cautious reading can be too quick if it treats every price gain as temporary. Dow entered the disruption from historically weak polyethylene pricing. Its April presentation argued that damaged supply, delayed capacity additions, feedstock pressure in Asia, and a higher structural risk premium could steepen the global cost curve for longer than the immediate conflict.[2] Dow's annual report also makes clear why its regional feedstock flexibility and integrated assets matter when energy and raw-material costs diverge.[4]
Self-help is a second, partly independent engine. Management now expects more than $1.3 billion of 2026 benefits from cost, productivity, growth-investment, and asset actions—about $200 million above its prior plan. Those savings can remain after polyethylene prices normalize.[1] But they are not free: Q2 operating EPS excluded net significant items of $0.45 per share, driven mainly by transformation costs, and the company recorded $526 million of pretax Transform to Outperform costs in the quarter.[1]
The balanced conclusion is that Dow has shown it can monetize a supply dislocation and move its cost base at the same time. It has not yet shown how much of the resulting earnings survives normal supply, positive volume, and the cash cost of restructuring.
What would break this read
This article's “price event, not demand turn” diagnosis would be invalidated if Dow reports positive company-wide volume in both of the next two quarters, excluding clearly identified maintenance effects, while Packaging & Specialty Plastics holds a substantial majority of its Q2 operating EBIT and trailing cash conversion improves. That combination would show that end-market throughput and self-help had taken over from scarcity without surrendering the margin gain.
A weaker price bridge alone would not settle the question. The decisive evidence is whether volume, operating profit, and cash can improve together after the easiest supply-shock comparison passes.
Watchlist
- Q3 2026 results: compare the group and Packaging price-volume bridges with Q2. Positive volume with resilient segment EBIT would be a better recovery signal than another headline sales increase.
- December 31, 2026 — self-help and cash: test the promised greater-than-$1.3 billion benefit against transformation costs, working-capital release, and full-year free cash flow. Savings count most when they arrive in cash without repeated exclusions.[1]
- Full-year 2026 results: two sequential quarters should reveal whether polyethylene scarcity merely pulled earnings forward or reset Dow's margin floor.
Dow's second quarter deserves credit for the magnitude of the turnaround. A 20% local-price increase, a $1.669 billion operating EBIT swing, and positive free cash flow are real outcomes. The analytical mistake would be to translate them automatically into recovered demand. Q2 showed what Dow's asset base can earn when supply tightens. Q3 and Q4 must show what customers will absorb—and how much cash the company keeps—when price is no longer the whole story.
Sources
- Dow Inc., “Dow reports second quarter 2026 results,” July 23, 2026 — sales, price-volume bridges, segment profit, EPS, cash flow, working capital, transformation costs, and self-help outlook.
- Dow Inc., 1Q 2026 Results presentation, April 23, 2026 — original Q2 modeling guidance, polyethylene pricing actions, supply-disruption thesis, asset-footprint claims, and cash priorities.
- ICIS, “US Dow raises Q2 guidance by 10% on strength in PE, PU chems,” June 9, 2026 — independent report on the pre-release guidance increase and chemical-market supply context.
- Dow Inc., 2025 Annual Report — integrated manufacturing, feedstock exposure, cyclicality, energy and raw-material risks, and regional operating footprint.
- Science History Institute, “Dow Chemical Company plant in Freeport, Texas,” 1952 — archival photograph and collection metadata.