Priced: more credit-card swipes mean more borrowing, more issuer interest income, and eventually more credit risk. New: the Federal Reserve's latest payments study shows credit-card transactions growing much faster than debit, while newer large-bank data show card purchase volume rising alongside lower utilization and a record share of accounts paying in full.[1][3]
Those facts are not contradictory. They belong to three different ledgers: the payment at checkout, the balance left after the bill arrives, and the loss recognized if repayment fails. The first is a relatively direct volume signal for networks and processors. The second and third decide whether the same activity helps or hurts lenders.
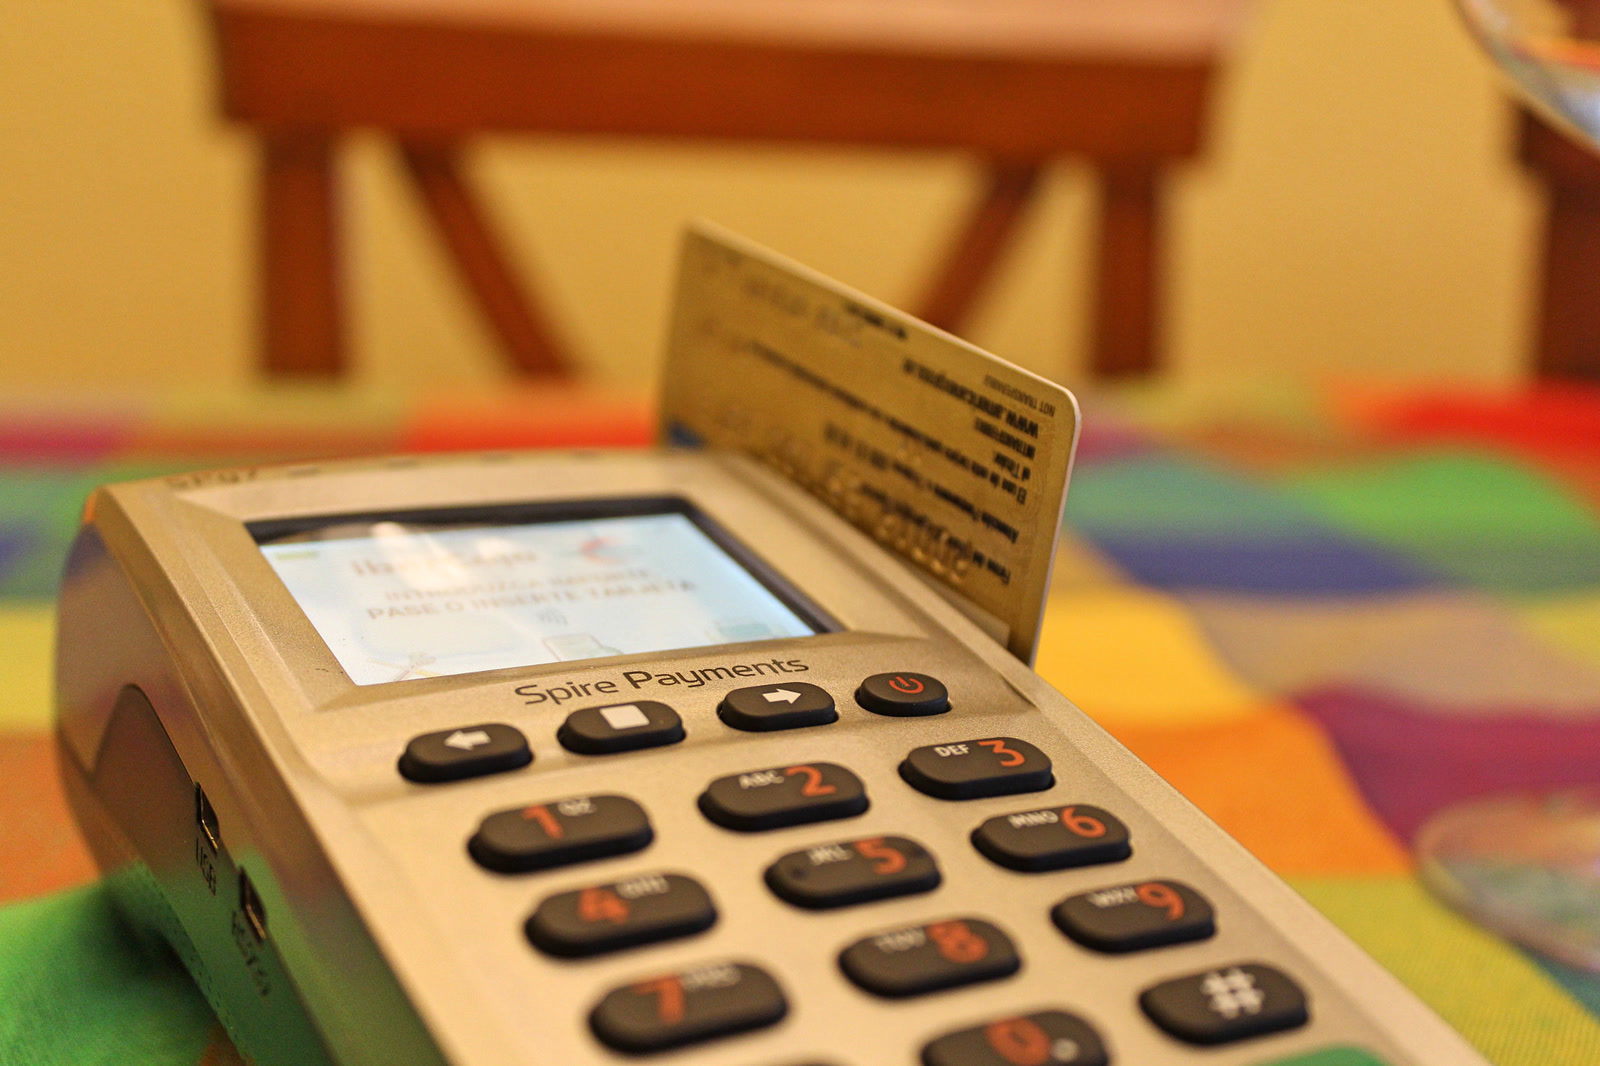
Image context: the cover is a real photograph of a card inserted into a retail terminal. It captures the observable event in the new Federal Reserve study—a completed payment—not an assumption about whether the customer later pays the statement in full.[1][10]
The crossover is real
The 2025 Federal Reserve Payments Study estimates that Americans made 67.1 billion credit-card payments in 2024, up 16.2 billion from 2021. That is a 9.6% compound annual growth rate. Debit still handled far more transactions at 120.6 billion, but added only 13.8 billion, for 4.1% annual growth. This was the first measured three-year period since the study began estimating national volumes in 2000 in which credit cards added more payments than debit cards.[1]
That is a genuine change in payment choice, not proof of a credit boom. The study counts payments made by consumers, businesses, and governments; for general-purpose cards, its figures are net, authorized, and settled transactions. It develops aggregate estimates from voluntary surveys of depository institutions, card networks, and major processors. It does not observe whether a household pays a card bill in full, carries the purchase for one month, or revolves it for a year.[1][2]
The distinction matters because a credit card performs two jobs. It is a payment credential at the terminal and a line of credit after settlement. The first job occurs on every successful transaction. The second is activated only when the customer leaves a balance unpaid.
Ledger one: payments
Every general-purpose card purchase passes through authorization, clearing, and settlement. More transactions therefore expand the activity base for the networks, processors, merchant acquirers, gateways, and fraud tools that move or protect the payment. That makes the Federal Reserve's crossover most legible as a payment-rail signal.
It is not a one-for-one earnings formula. Revenue depends on transaction mix, pricing contracts, cross-border exposure, average ticket, and value-added services; incentives, fraud, and operating costs absorb part of the growth. Even so, the causal chain is short: more completed card transactions mean more events for the payment stack to handle.
For an issuer, the chain is longer. A customer who pays in full can still generate interchange and annual-fee revenue, but also rewards, servicing, fraud, and acquisition expense. Interest income appears only if the customer revolves a balance. The checkout count alone cannot tell an investor which customer showed up.
Ledger two: balances
The Philadelphia Fed's first-quarter 2026 large-bank data make the separation unusually clear. Purchase volume was 6.4% higher than a year earlier, yet utilization fell to a three-year low of 19.1%, and the share of accounts paying their balances in full reached the highest level in that series.[3]
The Federal Reserve's broader G.19 release points in the same direction for May, with an important scope caveat. Seasonally adjusted revolving consumer credit stood at $1.344 trillion and contracted at a 4.7% annualized rate during the month. G.19 revolving credit is broader than credit cards, and one monthly rate is noisy, so it cannot validate the payments study by itself. It does show why transaction growth should not be translated mechanically into balance growth.[6]
This is the core issuer split. A larger transactor base can lift payment-related revenue without adding much interest income. A larger revolver base can lift interest income, but it also consumes capital and carries funding and loss risk. The same 67.1 billion payments can produce very different economics depending on what remains after the due date.
Ledger three: losses
Losses sit farther downstream. The New York Fed reported that credit-card balances fell by $25 billion in the seasonally soft first quarter of 2026 to roughly $1.25 trillion, while transitions into early delinquency edged down. The Philadelphia Fed likewise found that large-bank delinquency and charge-off measures had been improving, although delinquency remained above historical norms.[3][5]
These are not reasons to declare consumer credit healthy everywhere. They are reasons to keep the sequence straight. Purchase comes first; a revolving balance may follow; delinquency and charge-off arrive later, if at all. A rise in the first variable cannot establish a rise in the third.
The datasets also should not be spliced into a synthetic time series. The payments study estimates national 2024 transaction flows. The Philadelphia Fed covers large banks reporting through the Federal Reserve's Y-14M collection. The New York Fed uses a nationally representative credit-report panel. G.19 estimates broad consumer-credit balances. Together they triangulate the mechanism; they do not measure the same population or moment.[1][2][3][5][6]
Five anchors, five questions
- 67.1 billion credit-card payments: how often the credit rail was used in 2024.[1]
- 9.6% credit growth versus 4.1% debit growth: which card rail gained transaction momentum from 2021 to 2024.[1]
- 6.4% purchase-volume growth: whether large-bank cardholders were still spending in early 2026.[3]
- 19.1% utilization: how much of available large-bank card credit was actually drawn.[3]
- $1.344 trillion of revolving credit: the broad balance stock that can generate interest—and later losses—rather than merely payment fees.[6]
No single anchor answers all five questions. That is precisely why “credit cards are growing” is too imprecise to support an investment thesis.
The cleaner and conditional beneficiaries
The cleaner read-through belongs to businesses paid to route, authorize, settle, acquire, or secure transactions. They still face pricing and mix risk, but the new finding measures activity close to their revenue engine. A shift from debit to credit can also change economics within the stack because the products carry different routing, rewards, and acceptance arrangements.
The read-through for lenders is conditional. More purchase volume is helpful when interchange and fees exceed rewards, fraud, servicing, and acquisition costs. More revolving balances are helpful only if interest income exceeds funding, operating, and expected credit costs. A lender can therefore gain card engagement while producing less interest per account, or grow receivables while degrading the quality of future earnings.
That boundary also prevents a category error in valuation. Payment networks should not be valued as if they own the receivable merely because their brand sits on the card. Issuers should not receive full credit for transaction growth until disclosures show how much becomes profitable revolving balance and how much is paid away through rewards or credit costs.
Counterweight: restraint in aggregate can hide stress in distribution
The strongest challenge to a benign interpretation is distributional. The Fed's 2025 household survey found that 45% of card owners carried a balance at least once during the prior year. Among respondents who allowed survey answers to be linked to credit records, average balances from 2023 to 2025 rose 37% for people “finding it difficult to get by,” versus just 1% for those “living comfortably.”[4]
So payment substitution and borrower stress can coexist. Affluent transactors may be moving purchases onto rewards cards and paying in full, while financially strained borrowers accumulate balances and losses in a smaller part of the book. Aggregate utilization can fall even as the tail worsens. That makes issuer underwriting, borrower mix, and vintage performance more important—not less—when the headline transaction data look strong.
Falsifier
The thesis is that the new crossover currently says more about payment-rail preference than broad household leveraging, making transaction toll collectors the cleaner beneficiaries. That reading fails if the balance and loss ledgers begin moving with the payment ledger: specifically, if three consecutive G.19 releases show revolving credit growing at least 10% annualized, while the next New York Fed report shows card balances and both early- and serious-delinquency flows reaccelerating.[5][6]
That synchronized move would be evidence of a broad credit impulse rather than mostly a choice of rail. It would strengthen the near-term revenue case for issuers, but also raise the probability that today's finance charges become tomorrow's provisions and charge-offs.
Watchlist
- July 29, 2:00 p.m. ET — FOMC decision: a policy-rate change would flow quickly into variable card APRs and the incentive to pay in full. It changes the balance ledger more directly than the checkout ledger.[7]
- August 4, 11:00 a.m. ET — New York Fed Consumer Credit Panel: the scheduled release should update second-quarter card balances and delinquency transitions, the cleanest near-term check on whether stress is broadening.[8]
- August 7, 3:00 p.m. ET — G.19 Consumer Credit: June revolving credit will test whether May's contraction was noise or part of a softer balance trend.[9]
Takeaway
The Federal Reserve found a real crossover: credit-card transactions added more volume and grew faster than debit from 2021 to 2024. The mistake is treating every added swipe as an added loan.
For payment networks and processors, checkout activity is the product. For issuers, checkout is only the beginning of the income statement. The bill, the repayment decision, and the loss curve come later. Investors who keep those three ledgers separate can use the new data; investors who collapse them will mistake payment preference for leverage.
Sources
- Board of Governors of the Federal Reserve System, “National Payment Volumes, Top-Line Data (CY 2015–24),” 2025 Federal Reserve Payments Study.
- Board of Governors of the Federal Reserve System, “Federal Reserve issues initial findings from its 2025 triennial payments study,” July 1, 2026.
- Federal Reserve Bank of Philadelphia, “Large Bank Credit Card and Mortgage Data: 2026 Q1,” July 13, 2026.
- Board of Governors of the Federal Reserve System, “Economic Well-Being of U.S. Households in 2025: Credit,” May 2026.
- Federal Reserve Bank of New York, “Household Debt Balances Rise Slightly as Delinquency Transition Rates Hold Steady,” May 12, 2026.
- Board of Governors of the Federal Reserve System, “Consumer Credit—G.19,” July 8, 2026 release covering May 2026.
- Board of Governors of the Federal Reserve System, “Calendar: July 2026.”
- Federal Reserve Bank of New York, “Economic Indicators Calendar: August 2026.”
- Board of Governors of the Federal Reserve System, “Calendar: August 2026.”
- Wikimedia Commons, “File:Card Payment (176811287).jpeg,” photograph by Mañico, October 9, 2016, CC0 1.0.