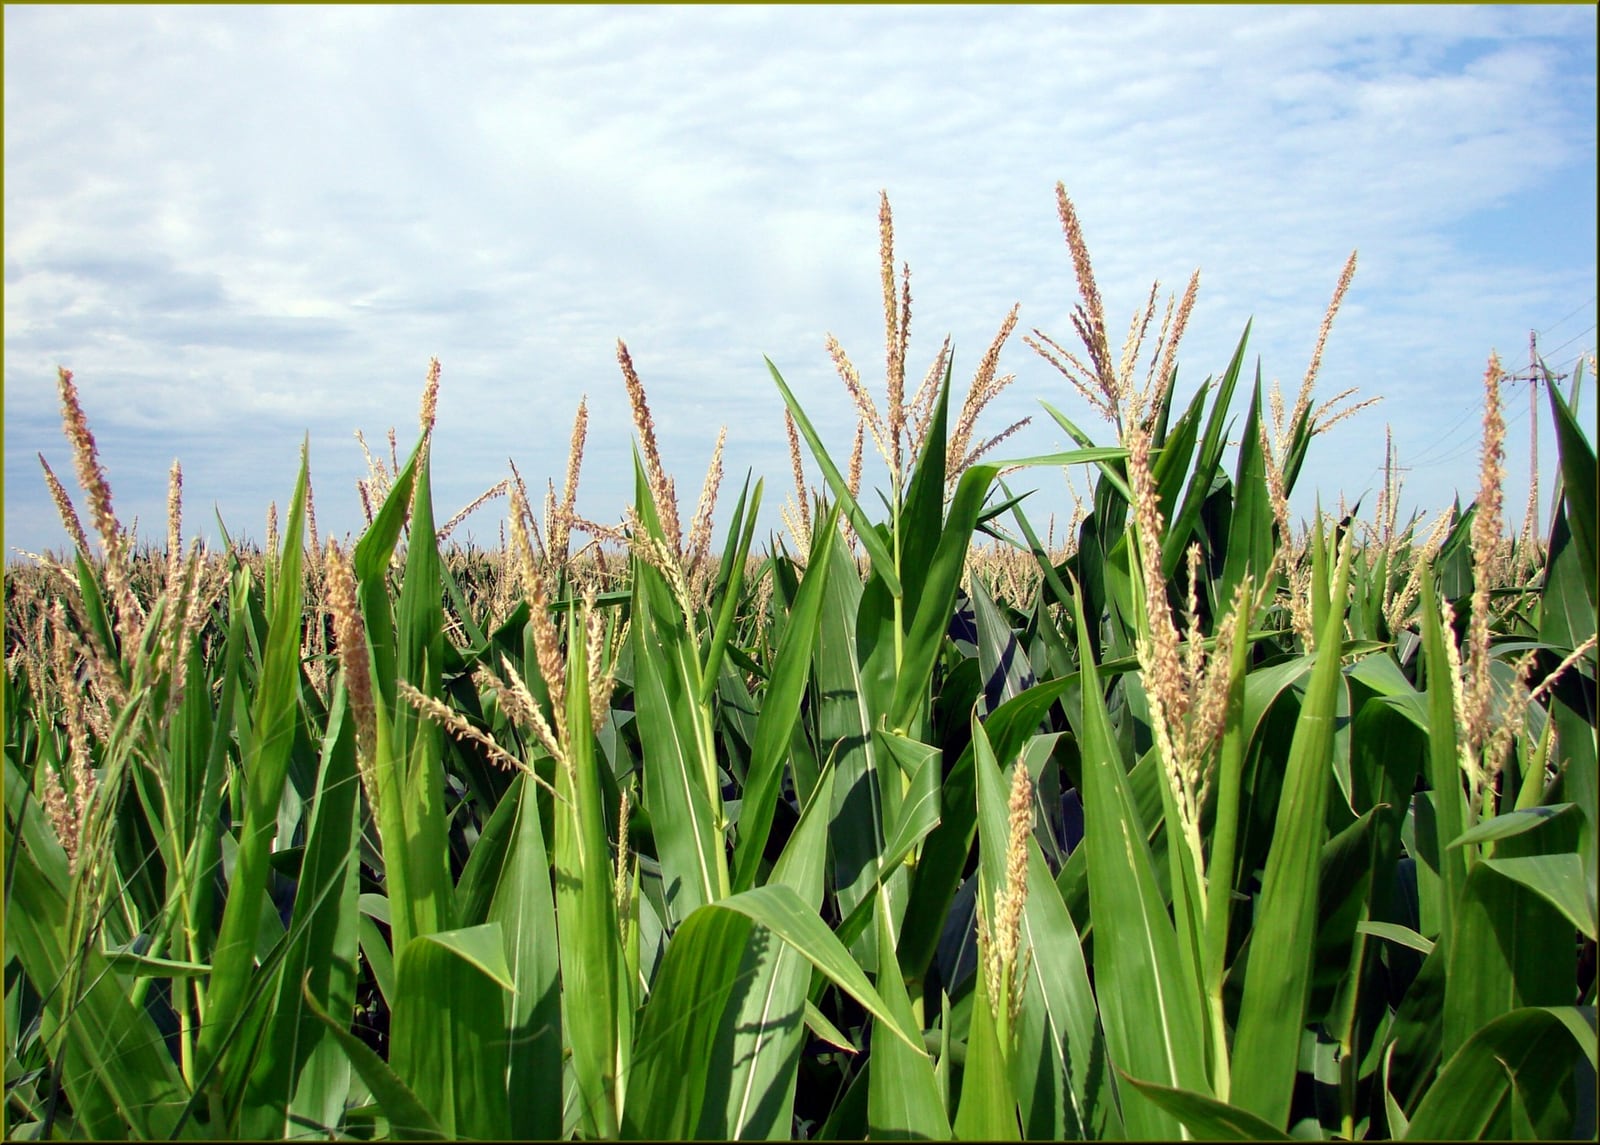
Priced: Friday’s corn rally paid for the U.S. Department of Agriculture’s smaller 2026/27 carryout. New: the same balance sheet still assumes 183 bushels per harvested acre just as pollination begins, so field conditions—not another inventory revision—now own the next move.[1]
That is a narrower and more useful setup than “the WASDE was bullish.” December corn gained 9 cents on Friday, while the July World Agricultural Supply and Demand Estimates report cut projected new-crop ending stocks by 170 million bushels.[1][5] The market has acknowledged the better starting arithmetic. It has not yet proved the yield that makes that arithmetic work.
Friday Closed the Inventory Argument
The July report resolved a mismatch left by the June 30 Grain Stocks survey. NASS counted 5.29 billion bushels of corn in storage on June 1, 14 percent more than a year earlier, yet disappearance during the first three quarters of the marketing year was strong enough to force a fresh look at use.[2] USDA responded by raising 2025/26 feed and residual use by 150 million bushels, trimming ethanol use by 25 million, and cutting old-crop ending stocks from 2.145 billion to 2.020 billion bushels.[1]
That lower beginning inventory carried directly into the new crop. USDA also raised the 2026/27 export forecast by 50 million bushels. With supply lower and use higher, projected ending stocks fell from 1.960 billion bushels in June to 1.790 billion in July. The agency nevertheless left its season-average farm-price forecast at $4.40 per bushel.[1]
The distinction matters. A stocks revision can reveal that the prior balance sheet was too loose without establishing that the next crop will be small. Friday’s price action rewarded the correction; from here, another durable leg higher needs either a production shortfall or demand that again outruns USDA’s assumptions.
One Bushel Now Has More Leverage
The causal chain is short. NASS estimates that farmers planted 95.3 million corn acres, 3 percent fewer than in 2025, and USDA expects 87.4 million acres to be harvested for grain.[2] At the unchanged 183-bushel yield, those acres still produce roughly 16 billion bushels.[1] Fewer acres therefore do not create scarcity by themselves. They make each change in yield matter more.
That yield is not a July field survey. USDA describes it as a weather-adjusted trend projection that assumes normal planting progress and summer growing conditions.[1] The number is therefore a baseline waiting for field evidence, not a measurement of the crop already standing.
Mechanically, one bushel per acre across 87.4 million harvested acres is about 87 million bushels of production. A three-bushel miss, with every demand line held constant, would remove roughly 262 million bushels—enough to move a 1.790-billion-bushel carryout close to 1.53 billion. That is a sensitivity, not a forecast: prices would alter feed, exports, and other use before the full change reached ending stocks. But it shows why an unchanged yield assumption has become the hinge rather than a footnote.[1][2]
The first field evidence is mixed rather than alarming. As of July 5, 16 percent of corn was silking, slightly ahead of the five-year average, while 67 percent of the crop was rated good or excellent. That condition score was unchanged for the week but seven percentage points below the prior year.[3] Condition ratings are observations, not a direct yield model; USDA’s Economic Research Service cautions that early scores generally do not predict final yield and identifies summer temperature and rainfall as the decisive inputs.[8] Still, their direction during silking and pollination now carries more information than another argument over June stocks.
This is the new spread in the market. If ratings stabilize and pollination advances without broad stress, 183 remains defensible and the July rally can lose its weather premium. If ratings deteriorate while more of the crop enters reproduction, even a modest yield cut has enough balance-sheet leverage to matter.
The Strongest Counterweight: 1.79 Billion Is Still a Buffer
The bullish reading should not turn a tighter forecast into a shortage story. USDA still projects a crop near 16 billion bushels and a 1.790-billion-bushel carryout. It also raised Argentina’s 2025/26 corn crop to 63 million metric tons, while projected global 2026/27 corn stocks, though cut by 6 million tons in July, remain 275.3 million tons.[1]
Those supplies are not perfectly interchangeable across place, grade, timing, or freight route. They are nevertheless a real counterweight. A healthy U.S. pollination window would leave buyers with a large domestic crop and meaningful foreign alternatives. USDA’s unchanged $4.40 season-average price is a quiet reminder that its own tighter balance sheet does not yet require demand rationing.[1]
The bear case is therefore stronger than “the crop looks fine.” It is that Friday’s revision merely corrected understated disappearance, while the combination of a large prospective harvest, foreign supply, and price-responsive demand keeps ending stocks comfortable. The bull case has to earn its next step in the field.
Soybeans Show the Demand Alternative
Soybeans offer a useful counterpoint. NASS estimated 85.4 million planted acres, up 5 percent from 2025.[2] USDA translated the larger area into a projected 4.475-billion-bushel crop at an unchanged 53-bushel yield. Yet new-crop ending stocks stayed at 310 million bushels because USDA raised exports by the same 30 million bushels that net supply increased.[1]
The market noticed the demand offset. August soybean futures closed Friday at $11.905 per bushel, up 1.1 percent on the day, after USDA also raised expected Chinese imports and kept U.S. new-crop carryout unchanged despite the larger harvest.[4]
Corn does not inherit that demand automatically. The soybean reaction simply clarifies the second route to a tighter balance sheet: production can meet expectations while exports absorb the extra bushels. For corn, weekly shipment and sales evidence must validate USDA’s higher export line before investors capitalize it as more than a forecast.
Falsifier
The thesis is that the July WASDE rally has become a weather-and-yield option, not the start of a self-sustaining inventory squeeze. It is falsified if crop ratings remain around the mid-60s or better through the core pollination window, the August 12 WASDE leaves yield close to 183 bushels per acre, and projected carryout remains at or above roughly 1.7 billion bushels.[1][3] That combination would show that the acreage base and demand buffer absorbed July’s stocks cut.
The thesis strengthens if condition ratings fall as silking broadens and USDA must cut yield, or if export evidence forces another use increase before harvest. Either path would make 1.790 billion a waystation rather than a floor. A one-day futures move alone confirms neither case.
Watchlist
First, watch July 13 at 4:00 p.m. ET, when NASS publishes the next Crop Progress report. The useful combination is not one national score in isolation, but silking progress alongside condition changes in the largest producing states.[6]
Second, watch the July 20 and July 27 Crop Progress releases. By then, much more of the crop should have moved through its reproductive window, making persistent deterioration harder to dismiss as weekly noise.[3][6]
Third, watch the August 12 WASDE. July incorporated acreage and stocks while holding yield steady; August is the first monthly balance-sheet checkpoint that can either preserve that yield bridge or acknowledge a weather-driven production change.[1]
Friday settled the old question: corn use was stronger and the prior carryout was too high. The market’s next question is physical. A tighter spreadsheet has already been bought; the crop now has to decide whether it was tight enough.
Sources
- U.S. Department of Agriculture, World Agricultural Supply and Demand Estimates, WASDE-673 (July 10, 2026) — official corn and soybean supply, use, yield, price, and release-calendar tables.
- USDA National Agricultural Statistics Service, “Corn planted acreage down 3% from 2025, soybean acreage up 5% from last year” (June 30, 2026) — official Acreage and Grain Stocks highlights.
- USDA National Agricultural Statistics Service, Crop Progress (July 6, 2026) — official national crop-stage and condition tables for the week ending July 5.
- American Soybean Association, “Export Demand Keeps Soybean Prices Firm Despite Bigger Crop” (July 10, 2026) — post-WASDE soybean futures reaction and demand-balance analysis.
- Total Farm Marketing, “TFM Daily Market Summary 07-10-2026” — Friday’s grain futures closes and the immediate post-WASDE market read.
- USDA National Agricultural Statistics Service, “Reports by Date: July 2026” — official publication times for the July 13, July 20, and July 27 Crop Progress reports.
- Wikimedia Commons, Don Graham, “Tasseled Out, Corn Crop, NW Iowa” (photographed July 25, 2013) — source page for the real field photograph used as the article image.
- USDA Economic Research Service, Feed Outlook: June 2026 — why early crop-condition ratings have limited yield value and why weather around silking matters more.