The expectation embedded in O-I's earlier outlook was a cash-generating turnaround; July's reset replaced that with cash consumption.[1] This argues for treating Europe's glass-bottle recovery as an unfinished restructuring, with cash benefits likely to arrive unevenly.
Evidence cut-off: September 15, 2026. Company forecasts below are identified as forecasts; the operating comparison uses releases published on July 28.
The furnace sets the economics
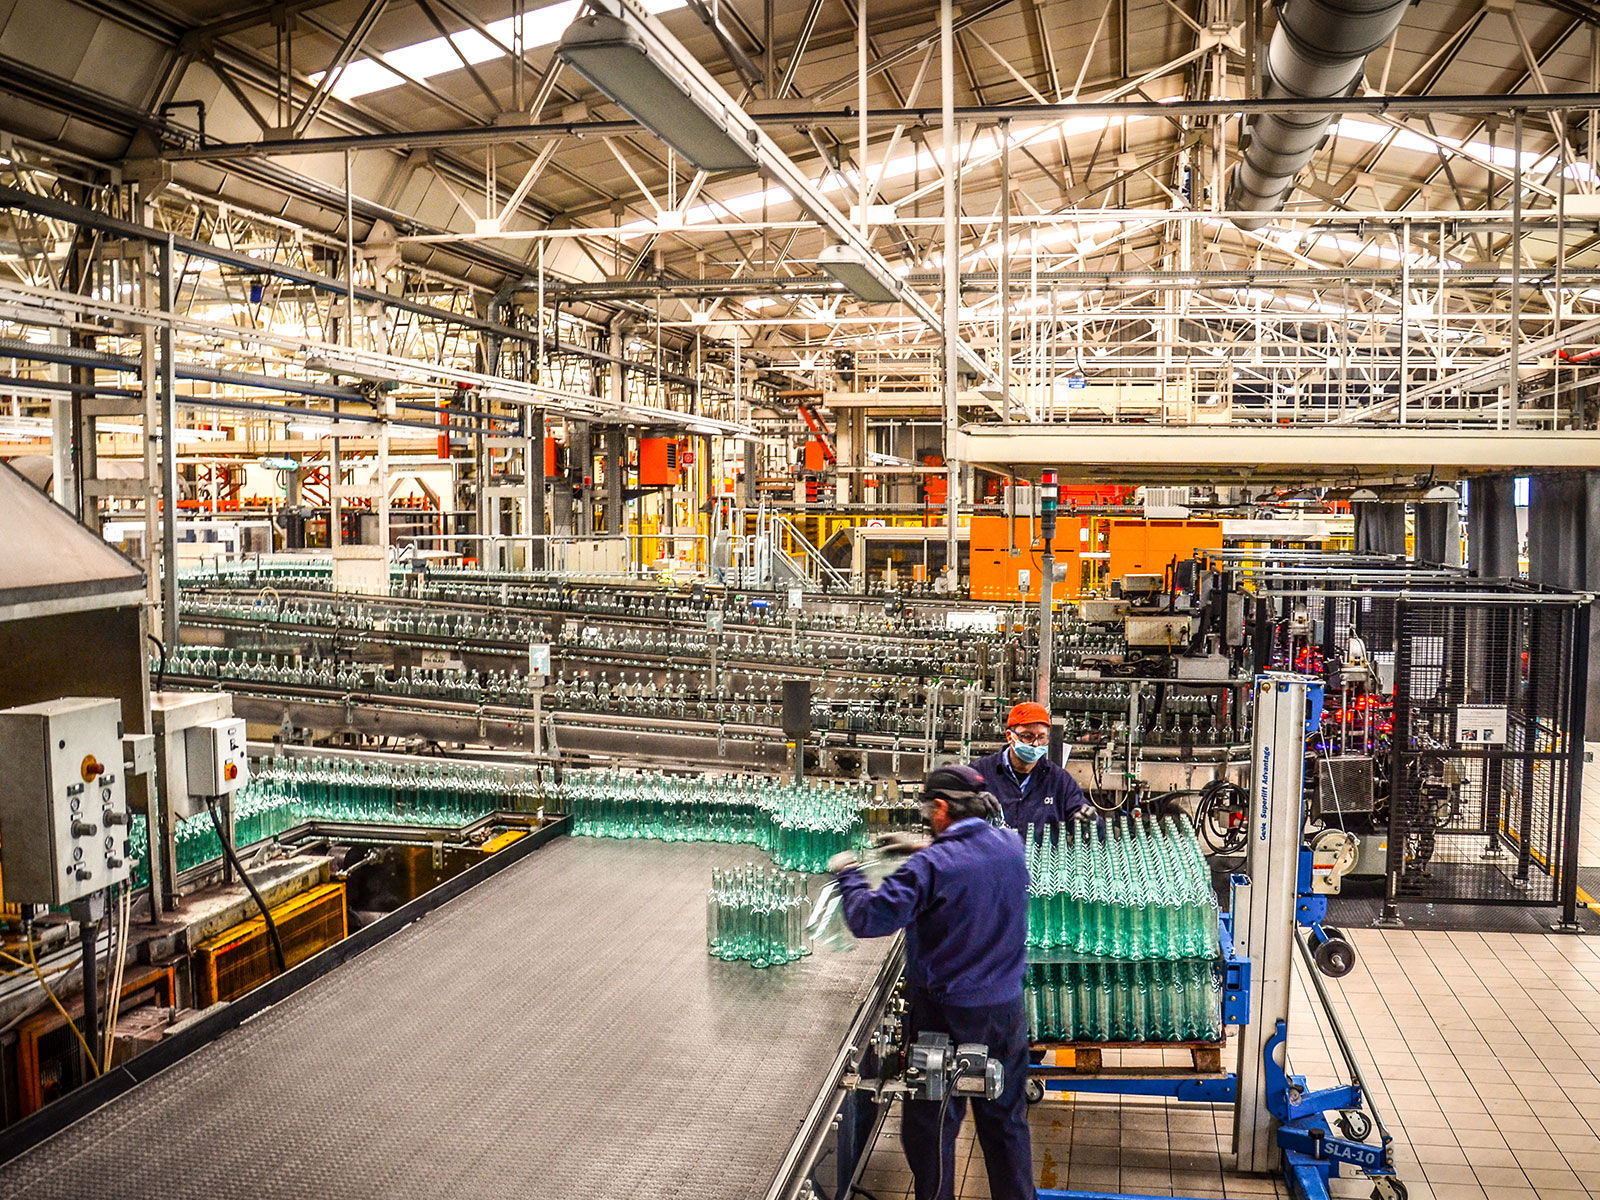
A bottle starts with a substantial energy bill. The U.S. Energy Information Administration describes melting and refining as the main focus of glassmaking's energy use: furnaces heat the raw materials, after which forming and finishing require further energy. Some installations supplement combustion with electric heating. The agency's account is older process evidence, useful for understanding the factory rather than estimating today's fuel mix or gas price.[3]
This gives a glassmaker several distinct ways to improve profit. It can earn more per bottle, lower the energy needed to make one, or spread its plant costs across more saleable output. Those routes require different evidence. A higher selling price does not demonstrate better thermal efficiency; cheaper fuel does not demonstrate stronger demand. Reading the earnings statement as a single recovery number obscures which improvement can persist.
Downtime also has a cost beyond the missing bottles. O-I's annual report identifies additional maintenance, production changeovers, shipping expense and capital spending, alongside weaker absorption of fixed costs when assets stop working. In plain English, a factory's continuing costs have fewer units to carry them.[2]
Concentrating orders in the surviving plants can therefore make sense. But the transfer itself has to work. A closure announcement records a decision; improved service, unit costs and cash generation establish its value. That is the operational hypothesis being tested here.
Less capacity can still mean too much capacity
The industry has already contracted. In its February statement, the European Container Glass Federation reported that European production had fallen about 10% between 2022 and 2024, alongside plant and furnace closures. FEVE represents producers and was lobbying for policy support, so its statement is evidence of the industry's position, not an independent verdict on which policy would restore competitiveness.[4]
A smaller supply base does not automatically confer pricing power. If customers also need fewer bottles, the remaining furnaces can still compete for insufficient work. Capacity must be judged against demand in the markets it actually serves. The useful question is whether the reshaped network has enough well-priced orders to run efficiently.
There is also a distinction between reducing capacity and improving the capacity retained. O-I's Villotta project combined oxygen-based combustion, preheating of recycled glass and recovery of waste heat. In its 2021 account, the company reported 35% annual energy savings from the upgrades.[5]
That is a plant-specific company claim, not a savings assumption for every furnace. Its significance is the mechanism: heat that previously escaped could perform useful work again. Such investment can lower the cost of existing production without requiring consumers to buy more drinks. It also demands equipment, implementation time and capital before the recurring benefit arrives.
Count the savings after the disruption
O-I reported $65 million in gross turnaround benefits in the second quarter, falling to $50 million after operational disruptions. Its revised annual free-cash-flow forecast moved from $50–150 million of generation to $50–150 million of consumption. European competitive pricing, energy costs and disruption all contributed to the weaker outlook; closures alone do not explain the reset.[1]
The gross-to-net difference is the useful analytical clue. A savings programme can make progress while the business consumes cash. Investors need both the operational bridge and the cash statement: the first explains what management improved, while the second shows what remained after the company's other demands on money.
The strongest counterweight is already operating
Verallia shows why that caution should not become a blanket bearish call on bottles. Its first-half volumes were stable, yet reported free cash flow increased from €66 million to €102 million. Management cited cost control and initial benefits from changing its industrial footprint. Improvement was possible without a broad volume rebound.[6]
The qualification is in the forecast's definition. Verallia's annual free-cash-flow target excluded planned restructuring cash payments connected with its footprint project. That does not make the measure useless: it can help describe the business after a transition. It does mean an investor assessing debt repayment must also account for those payments.[6]
O-I's definition, by comparison, subtracts property and equipment cash payments from operating cash flow.[1] The companies' headline cash figures should therefore be read on their own terms before being compared. A forecast presented before a closure bill and cash remaining after that bill answer different questions.
The falsifier: the cautious outlook would be wrong if the next reporting rounds show broad European improvement in margins and cash after restructuring payments, on stable volumes and input prices, with company reconciliations attributing recurring gains to network changes. That would support the view that the operating reset is already paying off. Until then, closure counts alone offer too little evidence to call the recovery complete.
What to watch
- O-I's October 28 results call: compare gross savings with benefits retained after disruption, and check whether the annual cash outlook improves.[1]
- Verallia's next trading update: look for progress on factory transfers and a clearer estimate of restructuring cash payments alongside its operating targets.[6]
- The full-year 2026 cash statements: reconcile operating cash, equipment spending and closure payments. Improvement that survives all three would make the recovery materially more convincing.
Sources
- O-I Glass, second-quarter 2026 earnings release, July 28, 2026 — savings, revised outlook, cash-flow definition and call calendar.
- O-I Glass, 2025 Annual Report — Form 10-K, Item 1 and Item 1A, particularly the operational-disruption risk on printed page 13.
- U.S. Energy Information Administration, “Glass manufacturing is an energy-intensive industry mainly fueled by natural gas” — manufacturing-process background.
- European Container Glass Federation, Antwerp press statement, February 11, 2026 — production history and the industry's policy position.
- Jess Baker, O-I, “O-I Villotta is a Model of Energy-Efficient Glass Manufacturing,” April 15, 2021 — plant upgrades, reported savings and photograph provenance.
- Verallia, “2026 first half results: Higher cash generation, 2026 outlook confirmed,” July 28, 2026 — volumes, cash generation and forecast exclusions.