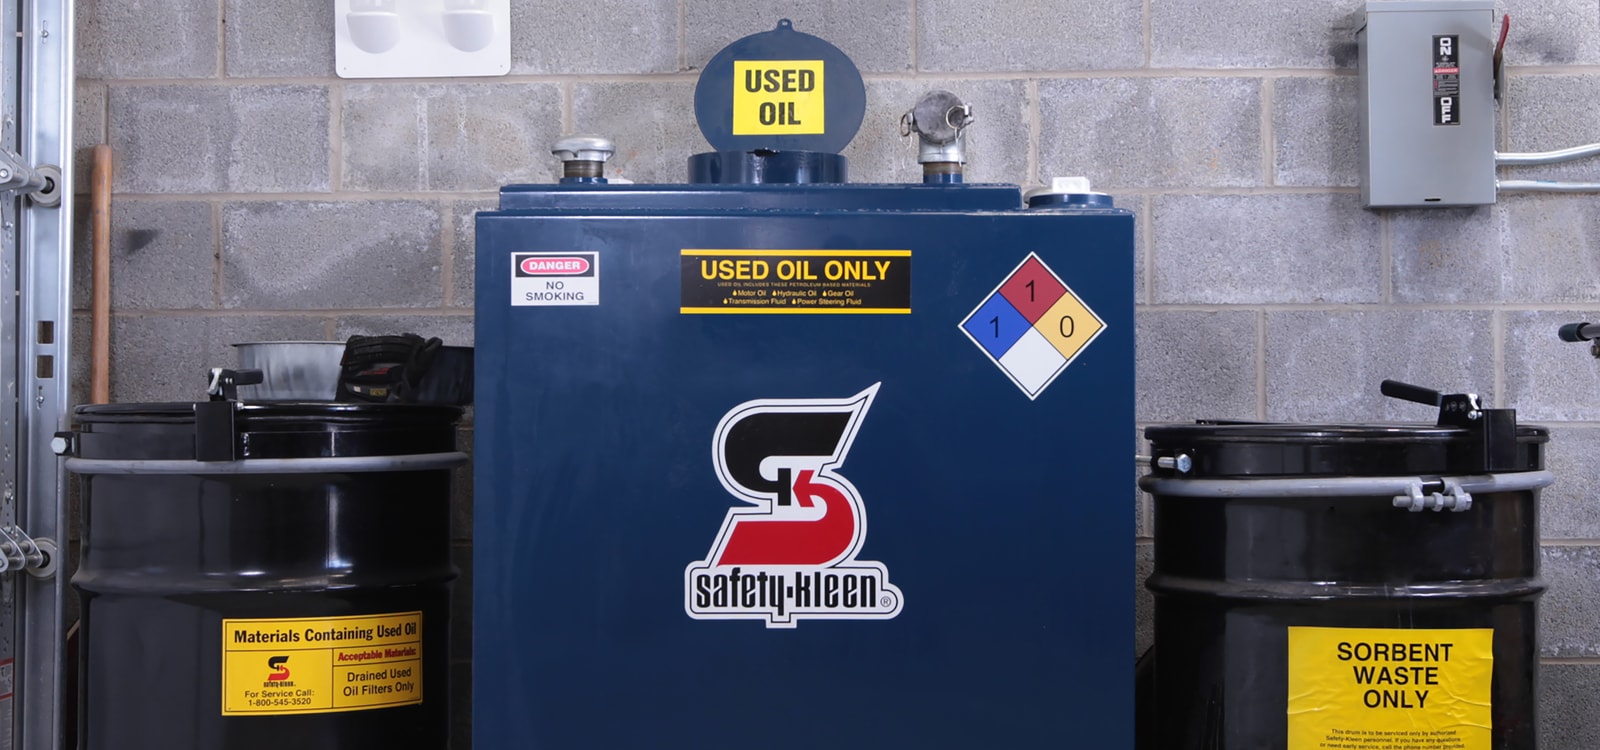
Priced: Clean Harbors closed at $303.37 on July 15, about 29% above its 2025 year-end close. On the latest share count and first-quarter balance sheet, that is roughly 14.3 times the midpoint of management's 2026 adjusted-EBITDA guidance and a 3.2% yield on management's adjusted free-cash-flow midpoint. New: Safety-Kleen Sustainability Solutions just increased quarterly adjusted EBITDA 17% even though its direct revenue fell 7%.[1][2][4]
That inversion is the investment question. Clean Harbors' used-oil operation can earn at two ends of the same chain: it can charge for a regulated collection service, then re-refine the gathered material into base oil and other products for sale. The first quarter showed one end compensating for weakness at the other. At the July 15 valuation, investors need that flexibility to be an economic architecture rather than a well-timed quarter.
The spread matters more than the oil price
Safety-Kleen is often treated as a simple downstream oil business. It is better understood as a managed spread across collection, transport, refinery throughput, product mix, and selling price.
When used-oil product values weaken, generators may have to pay more to have their oil collected. Clean Harbors calls that a charge-for-oil, or CFO. The economic inference from the spread that Clean Harbors describes is that when base-oil prices improve, the product end contributes more but competition for feedstock can return some of that benefit to the generator.[2][3] The company therefore does not own a permanent hedge. It owns the routes, customer relationships, processing assets, and commercial discretion with which to manage a moving one.
Q1 made the mechanism unusually visible. SKSS direct revenue fell to $207.0 million from $222.7 million, while adjusted EBITDA rose to $33.0 million from $28.3 million and margin expanded to 15.9% from 12.7%. The filing supplies the bridge: base-oil revenue declined by $9.3 million, mainly on price, while waste-oil collection-service revenue rose by $13.9 million. Management said the average CFO rate more than doubled year over year.[1][2]
At the same time, collection volume weakened. Safety-Kleen gathered 53 million gallons, down from 58 million a year earlier. Stronger collection pricing is useful; fewer gallons mean less feedstock for refineries with meaningful fixed costs. The sources do not establish that pricing caused the volume decline. The quarter proved that the company could defend profit during a weak product tape. It did not yet prove that collection pricing, gallons, product realization, and throughput can all improve together.[2][3]
The network is the asset—and the constraint
Clean Harbors collected about 243 million gallons of used oil in 2025 and operated seven re-refineries across the United States and Canada. Those plants turn used oil into base oils, blended lubricants, recycled fuel oil, and related products. The network links small local pickups to industrial-scale processing and an outlet for the finished material.[3]
Regulation reinforces the service value without eliminating competition. US rules under 40 CFR Part 279 impose storage, shipment-record, transporter, processor, and re-refiner requirements across the used-oil chain. A customer is therefore buying compliant removal as well as surrendering feedstock.[5] The investment inference is that route density, permits, tank capacity, refinery access, and product distribution make that service difficult to reproduce at scale; neither the regulation nor the installed network makes it a monopoly.
But the same physical network creates operating leverage in both directions. Trucks need economical routes. Refineries need enough gallons. Product tanks need buyers. Clean Harbors' annual filing explicitly warns that lower refinery throughput can hurt profitability because many costs are fixed.[3] A high CFO can protect the inlet spread for a while; it cannot make an underfed refinery efficient.
That distinction is why the stock's valuation matters. Using 52.85 million shares outstanding, the July 15 close implies equity value of about $16.0 billion. Adding roughly $2.10 billion of net debt produces enterprise value near $18.1 billion. Against the $1.24 billion to $1.30 billion adjusted-EBITDA guide, the midpoint multiple is about 14.3 times. The $490 million to $550 million adjusted free-cash-flow guide implies a midpoint equity yield near 3.2%.[1][2][4]
That cash measure needs its full label. Clean Harbors' reconciliation adds back $110 million of planned strategic-growth investment and includes $15 million of expected asset-sale proceeds. Removing both from the $520 million adjusted midpoint leaves roughly $395 million of operating cash flow less capital expenditure, or a yield closer to 2.5% on the July 15 equity value.[2][4]
These are approximate calculations, and the guidance is non-GAAP and company-wide; Environmental Services supplies most of the group's earnings. This analysis treats the price as demanding because the cash yield is modest and the SKSS margin improvement has only one reported quarter of evidence. Investors are not being paid as if Safety-Kleen merely gets through a difficult base-oil quarter. They are paying for the segment's service economics to make future quarters less cyclical.
Three paths through the second quarter
Base case: the segment clears management's Q2 bar
Collection pricing remains above the prior-year level but eases sequentially as product markets stabilize. Better base-oil realization and product mix offset the lower collection charge. The correct seasonal hurdle is Q2, not Q1: in Q2 2025, SKSS produced $197.7 million of direct revenue, $38.3 million of adjusted EBITDA, a 19.4% margin, and gathered 64 million gallons.[9][11]
On the Q1 call, management said Q2 SKSS adjusted-EBITDA growth would “probably” exceed 10% year over year. That is call commentary, not formal segment guidance, but it puts the base-case hurdle just above $42 million. Gathered gallons also need to recover meaningfully toward 64 million; a tick from 53 million to 54 million would be sequential growth without proving throughput durability.[10][11]
Clearing those bars would validate the balancing mechanism without proving a structural step-up. The market would still need evidence that more volume can pass through the refineries without giving the inlet spread back.
Upside case: collection and products contribute together
The CFO rate proves sticky, gallons return to around or above the 64 million year-earlier level, and base-oil pricing strengthens in Q2. More direct blended-lubricant sales and higher-value Group III production improve the product end of the mix. Direct revenue exceeds $197.7 million, adjusted EBITDA materially exceeds management's roughly $42 million commentary bar, and margin holds above 19.4%.[9][10][11]
This is the scenario required for a further rerating from the July 15 valuation. It would show that the company is doing more than transferring earnings from product sales to collection fees. It is widening the total value captured per gallon.
Downside case: the hedge closes before volume returns
Competition forces collection charges lower as product values improve, but gathered gallons remain closer to Q1's 53 million than Q2 2025's 64 million. Alternatively, base-oil pricing stays soft while customers resist another high collection charge. Either path leaves fixed refinery costs spread over too little throughput. Adjusted EBITDA at or below $38.3 million and margin materially below the 19.4% year-earlier level would miss management's call commentary and show that Q1's collection cushion did not scale into the seasonally stronger quarter.[9][10][11]
The interval between $38.3 million and roughly $42 million is a miss against management's call commentary, but not the full downside case; it would leave the durability question unresolved. At or below the prior-year EBITDA anchor, Q1's margin expansion would look cyclical rather than structural. At roughly 14.3 times guided adjusted EBITDA, the risk would not be an immediate liquidity problem; it would be multiple compression as investors stop capitalizing a service cushion that could not survive normalization.
The strongest counterweight
The cautious case can underrate what Q1 already demonstrated. Product revenue weakened, gathered gallons fell in Q1, and yet the segment produced more EBITDA and 320 basis points of margin expansion. Clean Harbors also raised the midpoint of its company-wide adjusted-EBITDA guide by $40 million and its adjusted free-cash-flow midpoint by $10 million after the quarter.[8] On the call, management said the 2026 SKSS adjusted-EBITDA midpoint had moved to about $165 million from roughly $135 million, indicating that the segment—not only Environmental Services—was central to the revision.[10] A business that can charge appropriately for collection while developing higher-value products deserves a better multiple than a stand-alone base-oil refiner.
The counterweight has a boundary: the $165 million figure was management commentary, not formal segment guidance or a reported result. The next segment print still needs to prove that Q1's margin architecture can scale into Q2.
Falsifier
The thesis here is that the share price treats Safety-Kleen's margin improvement as more durable than one quarter has established. That caution is falsified if Q2 shows all four of the following: direct revenue exceeds the $197.7 million year-earlier level, adjusted EBITDA reaches at least $45 million, margin remains at or above 19.4%, and gathered gallons return to around 64 million even as CFO stops rising sequentially. The $45 million threshold is this analysis's deliberately stricter sensitivity, not management guidance. Together, those results would show that volume and product realization can replace a collection-price tailwind while beating the seasonally relevant margin and management's call commentary.[9][10][11]
The opposite combination confirms the risk: CFO eases, gallons remain closer to 53 million than 64 million, product realization does not fill the gap, adjusted EBITDA falls below $38.3 million, and margin lands materially below 19.4%. One weak metric is noise. Failure across the chain would show that the two ends do not hedge each other as reliably as the valuation assumes.[9][11]
Watchlist
- July 29, 2026 — Q2 results: reconcile SKSS direct revenue, adjusted EBITDA, margin, gathered gallons, average CFO, base-oil realization, and direct blended-product sales. Use Q2 2025's $197.7 million of revenue, $38.3 million of adjusted EBITDA, 19.4% margin, and 64 million gallons as the year-over-year baseline; compare EBITDA with management's call commentary for growth above 10%.[6][9][10][11]
- July 29, 2026 — full-year guidance update: compare the current $1.24 billion-$1.30 billion adjusted-EBITDA and $490 million-$550 million adjusted free-cash-flow ranges with any revision, then separate the contribution from SKSS from the larger Environmental Services business.[2][6]
- 2028 — East Chicago 600N unit target: track spending and commissioning for the planned solvent-deasphalting unit. It is a longer-dated test of whether Clean Harbors can move the product mix upward rather than depend on collection pricing to carry the spread.[3]
Clean Harbors has built something more resilient than an oil-price trade: a regulated collection network connected to re-refining and distribution. Q1 showed that the inlet can earn when the outlet does not. The stock now needs proof that both ends can earn in the same quarter.
Sources
- Clean Harbors, Form 10-Q for the quarter ended March 31, 2026 — segment revenue bridge, balance sheet, debt, cash, securities, and share count.
- Clean Harbors, First Quarter 2026 Investor Review (May 6, 2026) — SKSS revenue, adjusted EBITDA, margin, gathered gallons, CFO commentary, product mix, and 2026 guidance.
- Clean Harbors, Form 10-K for the year ended December 31, 2025 — used-oil collection volume, re-refinery network, products, fixed-cost exposure, and the East Chicago project.
- Clean Harbors, “Historical Price Lookup” — July 15, 2026 and December 31, 2025 closing prices supplied by LSEG.
- US Environmental Protection Agency, “Managing Used Oil: Answers to Frequent Questions for Businesses” — federal handling, transporter, processor, and re-refiner requirements.
- Clean Harbors, “Events & Presentations” — July 29, 2026 Q2 results and conference-call schedule.
- Safety-Kleen, “Used Oil Collection” — official service description and source page for the article's documentary photograph.
- Clean Harbors, “Clean Harbors Announces First-Quarter 2026 Financial Results” (May 6, 2026) — updated guidance and changes from the prior adjusted-EBITDA and adjusted free-cash-flow midpoints.
- Clean Harbors, Form 10-Q for the quarter ended June 30, 2025 — Q2 2025 SKSS direct revenue, adjusted EBITDA, and segment margin used as the seasonal comparison.
- StockAnalysis, Clean Harbors Q1 2026 Earnings Call Transcript (May 6, 2026) — management commentary on the 2026 SKSS adjusted-EBITDA midpoint and expected Q2 year-over-year growth.
- Clean Harbors, “Clean Harbors Announces Second-Quarter 2025 Financial Results” (July 30, 2025) — the 64 million gallons gathered in Q2 2025.