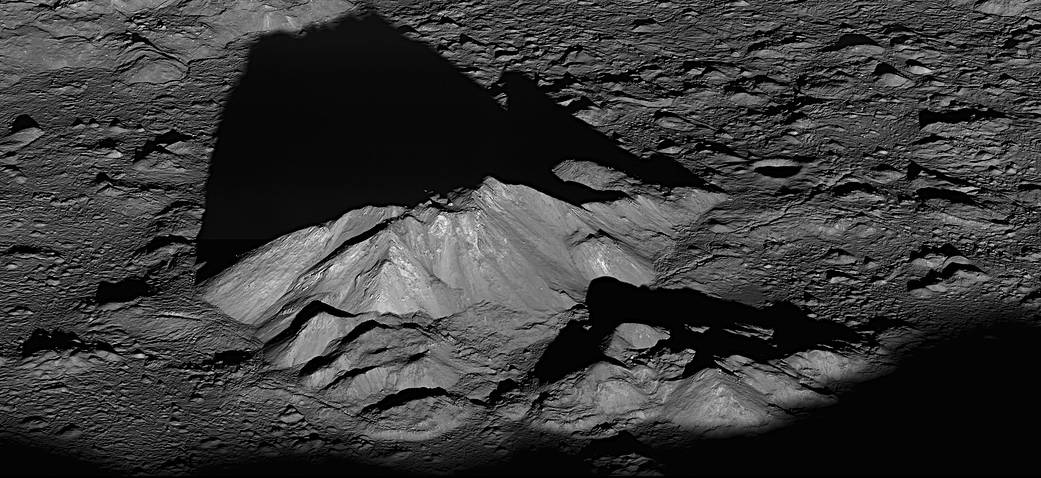
At sunrise inside Tycho crater, the central mountains cast a shadow across the crater floor. NASA’s Lunar Reconnaissance Orbiter photographed this scene in June 2011, looking obliquely across a peak complex about 15 kilometres wide.[6] The picture makes lunar terrain look wonderfully legible. Turning millions of less spectacular features into comparable measurements is a different kind of seeing.
LUC-GRAS200 brings that work to a new scale. Announced by the Chinese Academy of Sciences’ National Astronomical Observatories on July 2, 2026, the catalogue contains 10,699,651 lunar craters, from 200 metres to 2,050 kilometres across.[1] The research, led by Wei Zuo and colleagues, appeared in Journal of Geophysical Research: Planets on June 24.[2] For a scientist opening the dataset, the important question begins after the count: which of these entries can support the comparison they want to make?
The growth is in the small craters
China’s work on this problem predates the current catalogue. In December 2020, Jilin University described a collaboration that used deep transfer learning on Chang’e-1 and Chang’e-2 observations to identify 109,956 previously unrecognised craters. It also assigned geological periods to 18,996 newly identified craters larger than eight kilometres. Known examples supplied the starting knowledge from which the networks learned.[3]
Those figures describe a different research product. Dividing today’s total by the earlier discovery count would not measure an improvement in model accuracy. One number counts a catalogue’s contents; the other counts newly identified features within an earlier study.
The 2026 observatory announcement locates the expansion more precisely: roughly 79% of the entries are between 200 metres and one kilometre across. The workflow combines Chang’e-2 imagery at seven-metre resolution with elevation data and LRO terrain information, then uses automated detection, terrain measurements, human validation and comparisons with other catalogues.[1]
The scientific opportunity is to ask smaller questions over larger areas. A researcher can start with a region and a size range, then examine the population of craters within them. That makes the rules for including a feature as consequential as finding it in the first place.
Before the census comes the training image
The paper identifies YOLO-SCNet as the detection model used in the study.[2] Its public repository offers a revealing view of the preparation work. The Chinese-language instructions begin by dividing lunar images into overlapping tiles. The reason is concrete: a crater straddling the boundary between two images may otherwise escape detection.[4]
The same instructions ask annotators to cover different crater sizes, types, lighting conditions and backgrounds, and to assemble background imagery spanning different lunar landforms. They then describe generating training samples and converting annotations for model training.[4]
This is where an apparently simple instruction—find the craters—becomes a collection of practical judgments. Which examples teach the model what counts? Does a difficult feature remain visible after the image is divided? Have the training examples shown enough variation in illumination? The repository makes these questions inspectable, although its availability alone does not demonstrate that another team has reproduced the full global catalogue.
Two kinds of confidence in one row
The released data dictionary is especially useful. Each entry can carry position, diameter, depth, rim height and slope measurements. A field called confidence_level describes reliability as a genuine impact feature. Separately, secondary_confidence describes confidence that the crater is secondary.[5]
A secondary crater forms when material thrown out by a larger impact falls back and strikes the surface.[2] It can be perfectly real while recording a different relationship to the original impact event. Consequently, a high secondary-confidence score should never be read as a general certificate of detection quality.
Imagine an analyst selecting craters to study a region’s impact history. They would first need to distinguish reliable detections from doubtful features, then decide how to handle likely secondaries. Reversing or conflating those decisions could produce a carefully filtered sample that answers the wrong question. This is an implication of the field definitions, rather than a result from a new analysis of the catalogue.
The distribution page lists a full catalogue, a secondary-focused file and a README. The documentation also flags elevation-resolution boundaries and recommends separate statistical baselines for polar and non-polar regions.[5] Useful access means being able to carry those qualifications into the next calculation.
A lower size limit is not a completeness guarantee
The observatory reports that detection completeness exceeds 90% above approximately one kilometre. Its stated global median completeness diameter is about 330 metres.[1] These are the team’s reported catalogue characteristics, not an independent evaluation or a claim about every location.
The distinction matters at the small end. Including detections down to 200 metres does not establish that all 200-metre craters are equally discoverable. The paper explicitly identifies illumination, changes in elevation-data resolution and secondary-crater contributions as complications, particularly for small craters and high latitudes.[2]
For a regional comparison, the practical inference is straightforward: use a size range and quality selection defensible in both regions before interpreting a difference in counts. Otherwise, an apparent geological contrast may partly describe the observing and detection process.
LUC-GRAS200’s contribution to China’s scientific AI effort is therefore visible in the work it enables after inference. A catalogue lets another researcher select, compare and challenge the measurements without starting again from the orbital archive. The next convincing demonstration of its value will be a geological conclusion that remains stable when researchers change reasonable quality filters. Ten million entries give them much more material with which to try.
Sources
- National Astronomical Observatories, Chinese Academy of Sciences, “A global lunar crater database reaches the ten-million scale” (July 2, 2026; Chinese-language first-hand announcement). Catalogue scope, input data and reported completeness.
- Wei Zuo and colleagues, “LUC-GRAS200: A Global Lunar Crater Catalog at Sub-Kilometer Scale–Construction, Validation and Spatial Characteristics,” Journal of Geophysical Research: Planets (June 24, 2026). Abstract, plain-language summary and data/software availability statement.
- Jilin University, “A collaborative team provides new data and methods for lunar and planetary exploration” (December 30, 2020; Chinese-language first-hand report). Earlier Chang’e crater-detection and geological-period estimation work.
- National Astronomical Observatories research repository, YOLO-SCNet. Chinese-language README on image tiling, annotations and training-sample preparation; consulted September 29, 2026.
- China Lunar Exploration Program Data Release and Information Service System, LUC-GRAS200 dataset and linked README, version 1.0.0 (April 2026). File inventory, confidence-field definitions and resolution flags.
- NASA, “Tycho Crater’s Peak” (June 30, 2011). Archival LRO photograph captured June 10, 2011, credited to NASA Goddard/Arizona State University.