A logic analyzer can record a signal and still leave the engineering problem unsolved. One instrument needs firmware uploaded before it will enumerate. Another hides behind a serial port. A third speaks USB but exports a vendor-specific file. Even after acquisition works, a screen full of edges is not yet an I²C transaction, a MIDI message, or a memory command.
sigrok matters because it does not try to solve all of those problems in one application. Its architecture separates the hardware driver, acquisition session, normalized data feed, saved capture, frontend, and protocol decoder. That division turns unlike instruments into one measurement pipeline while preserving the boundaries at which a result can go wrong.
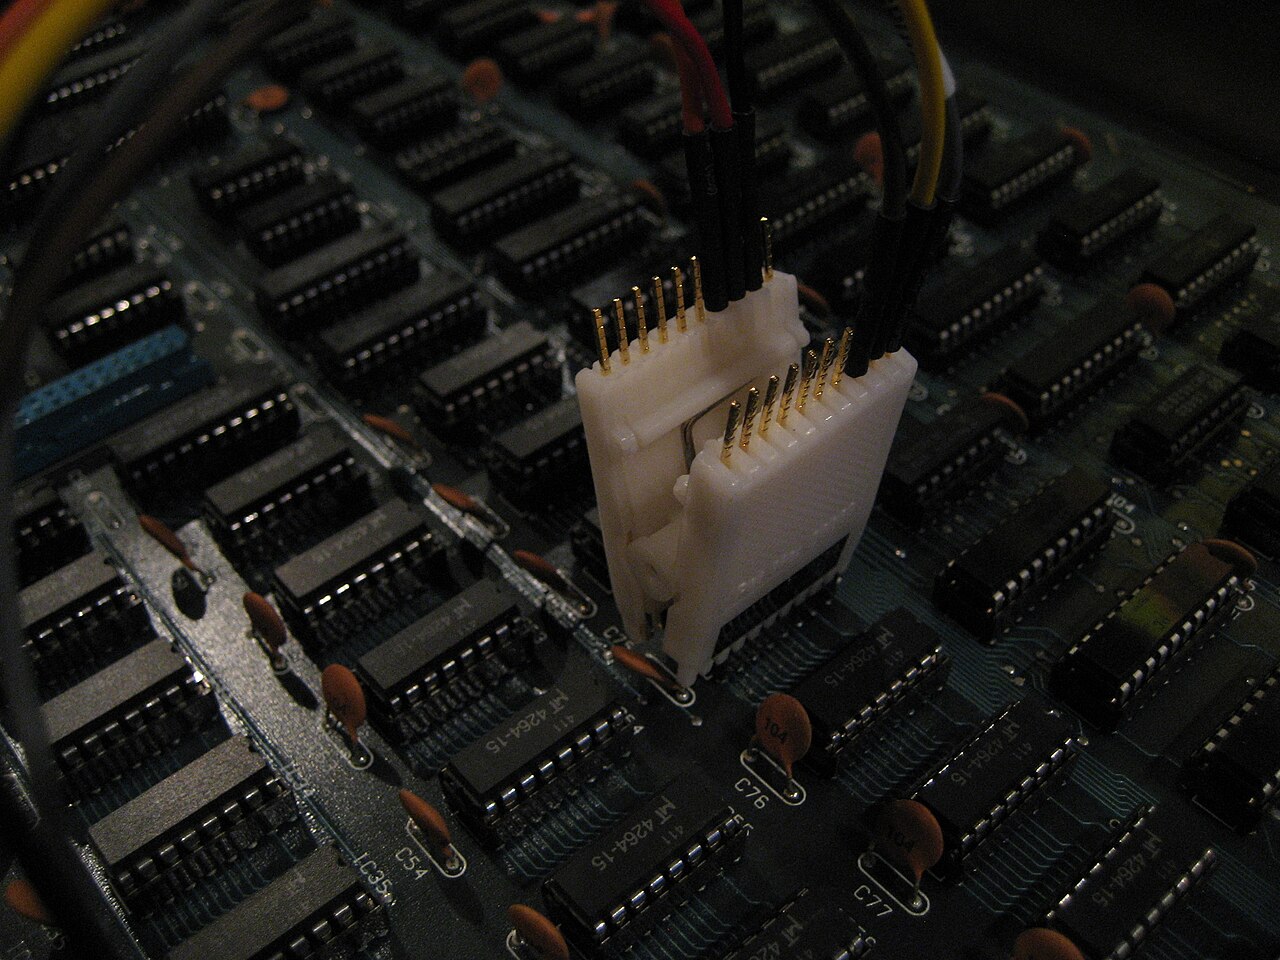
The photograph above shows probe leads from a Saleae Logic analyzer clipped to the memory board of an E-mu Emulator II sampler in 2011.[12] It is more than electronics-bench atmosphere. sigrok documents support for that first-generation, FX2-based analyzer through its open fx2lafw firmware path.[7] The probes, board, and analyzer remain stubbornly physical; the software earns its keep by making what crosses those probes portable.
The probe owns the first truth
The pipeline begins outside the software. A driver cannot repair a missing ground connection, an unsafe voltage, a probe on the wrong pin, or a sample rate too low to resolve the edges that matter. The original Saleae Logic page makes the boundary unusually concrete: eight channels, sampling up to 24 MHz, fixed digital thresholds, no onboard capture memory, and software-only triggering.[7] In that design, the host is not merely a viewer. It is part of the acquisition path.
That is why “supported hardware” is a compatibility statement, not a measurement guarantee. At publication, the project's hardware index counts 258 supported devices, alongside 27 in progress and 144 planned, but warns that the table follows the latest libsigrok development tree and that release builds may support fewer devices.[6] Support can also vary by function. A device may expose logic channels while an analog mode, trigger feature, or configuration option remains incomplete.
The right first question is therefore not “Does PulseView show traces?” It is “What did this hardware actually sample under these electrical conditions?” Channel labels, threshold assumptions, firmware, sample rate, and trigger behavior belong with the capture because every later layer inherits them.
A driver turns a device into an instance
At the libsigrok boundary, each hardware driver registers a common set of operations. The released libsigrok 0.5.2 header's sr_dev_driver contract covers discovery and lifecycle—scan, dev_open, dev_close—plus configuration and acquisition start/stop callbacks.[1] USB drivers can search by identifiers; serial devices may need an explicit conn value such as a device path and serial parameters. A frontend asks the driver for an instrument instance instead of learning the instrument's wire protocol itself.
This is the first architectural compression. PulseView does not need its own implementations for every analyzer and scope it can use. sigrok-cli does not need a second driver set for the broader device classes it exposes. Device-specific code owns enumeration, firmware handoff, transport quirks, and conversion from native packets. The frontend owns selection and intent.
Configuration remains device-aware rather than falsely uniform. A logic analyzer may accept samplerate and a sample limit; a meter may expose a logging interval; a serial instrument may require conn. The shared API standardizes how those capabilities are discovered and set, not which capabilities every instrument must possess.[1] That distinction prevents the abstraction from promising a lowest-common-denominator device that does not exist.
The data feed is the waist of the stack
Once acquisition starts, drivers publish typed packets into libsigrok's session data feed. The released header defines header, metadata, trigger, frame-boundary, logic, analog, and end packet types.[1] Hardware-specific USB frames no longer travel upward as hardware-specific USB frames. They become sample data plus enough context for a consumer to interpret their position in the session.
That narrow waist makes frontends interchangeable. In current PulseView source, pv::Session coordinates the libsigrok session and owns captured logic and analog data through segment objects.[5] sigrok-cli can drive the same acquisition path without a GUI, write samples to standard output, or save them for later processing.[9] A custom program can consume the library bindings without pretending to be PulseView.
It also makes files act like instruments. A version-2 .sr session is a ZIP container with a version record, INI-style metadata, and captured sample files.[2] Reopening it feeds recorded evidence back through the software stack. The device is absent, but the sample stream and acquisition context remain available.
That enables a useful laboratory habit: capture once, interpret many times. A minimal two-pass workflow can look like this:
sigrok-cli --driver fx2lafw --config samplerate=1m \
  --channels 0=RX --time 3s -o uart-capture.sr

sigrok-cli -i uart-capture.sr \
  -P uart:rx=RX:baudrate=115200
The first command acquires evidence. The second proposes a meaning. The CLI documents the same separation for richer cases: multiple decoders in one -P argument form a stack, while separate -P arguments create decoder stacks that run in parallel.[9] An independent Hackaday investigation used the pattern in practice, saving a triggered .sr capture from an Openbench Logic Sniffer and then running separate SPI decoding passes to extract two binary streams from a laser sensor.[11]
Protocol decoders own meaning, not acquisition
libsigrokdecode treats protocol interpretation as its own subsystem. Decoders are Python modules. They receive streamed or file-backed samples in chunks, publish annotations, metadata, binary output, or higher-level protocol data, and can be stacked so one decoder's output becomes another decoder's input.[3]
This is the second architectural compression. An I²C decoder should not care whether its edges came from an inexpensive FX2 board, a benchtop mixed-signal instrument, or an old .sr file. An EEPROM decoder should not have to rediscover start conditions and acknowledgements; it can sit above the I²C decoder. The CLI's documented examples—i2c,eeprom24xx and uart,midi—make the layering visible.[9]
The version-3 decoder API improves the inner loop as well. Instead of requiring Python code to inspect every sample one by one, a decoder expresses conditions through self.wait(), allowing the C backend to advance until a relevant edge or state appears.[4] Decoder authors still write state machines, but the most repetitive sample walking moves below the Python boundary.
The breadth is substantial: at publication, the project's decoder index lists 131 supported protocol decoders.[8] The more important property, however, is composability. A new device driver can immediately serve existing decoders. A new decoder can immediately operate on captures from existing drivers. Hardware and protocol coverage multiply rather than grow as paired integrations.
Each boundary has its own failure signature
Clean layers do not make measurement infallible. They make failures easier to name.
- Physical failure: the wrong pin, threshold, ground, probe loading, or sample rate produces bad evidence. No decoder setting can recover transitions that were never captured.
- Driver failure: discovery can break on permissions, missing firmware, ambiguous USB identifiers, or a transport option such as
conn. The failure happens before a trustworthy data feed exists.[1][7] - Throughput failure: samples arrive faster than the host path can consume or store them. The sigrok CLI documentation explicitly recommends capture-first processing and warns that its single-threaded path can terminate early under excessive formatting or decoding load; for high sample rates it recommends low-overhead binary capture and buffered compression.[9]
- Session failure: a saved trace without channel names, sample-rate context, firmware provenance, or the command that created it is evidence with a missing chain of custody. The
.srcontainer preserves defined metadata, but it cannot preserve laboratory facts nobody recorded.[2] - Decoder failure: the wrong channel map, baud rate, polarity, word size, or decoder order can turn real edges into a plausible but false story. Stacking compounds the risk: a mistaken low-level interpretation becomes the input to a confident higher-level one.[3][9]
- Frontend failure: a rendering or navigation problem may make a correct capture hard to inspect, but it does not automatically implicate the driver or decoder. PulseView's session and stored data objects are separate from the library's acquisition callbacks for exactly this reason.[5]
This vocabulary changes debugging. “sigrok is wrong” is too broad to be useful. “The driver stopped before SR_DF_END,” “the capture aliases the clock,” or “the EEPROM decoder received the wrong I²C channel map” points to a layer with an owner and a reproducible test.
Adoption means pinning a working cross-section
For a firmware team, repair lab, hardware-reuse project, or teaching bench, sigrok is strongest when several instruments must feed a common evidence workflow. Standardize a known-good probe setup; record the driver and acquisition options; save the raw .sr file before performing expensive decoding; keep decoder configuration beside the capture; and test the result against a bus transaction whose meaning is already known.
The operational boundary deserves equal attention. The downloads page currently recommends nightly builds as the up-to-date path while listing formal releases such as libsigrok 0.5.2, libsigrokdecode 0.5.3, sigrok-cli 0.7.2, and PulseView 0.4.2.[10] Meanwhile, the hardware and decoder indexes describe development-tree snapshots.[6][8] A team that depends on a recently added driver should therefore pin the exact package or build it validated; “sigrok supports this device” does not identify which distribution artifact contains that support.
That release shape is not automatically a reason to reject the project. It is a reason to treat the tested software cross-section—library, firmware, frontend, decoder tree, operating-system permissions, and hardware revision—as part of the lab configuration. A two-person embedded team can do this with a checked-in capture command and a known workstation image. A larger validation lab may need packaged builds, golden traces, automated decoder tests, and explicit ownership of upgrades.
sigrok's real achievement is not that one GUI recognizes many instruments. It is that a physical measurement can cross distinct, inspectable contracts: device to driver, driver to data feed, data feed to session, session to file or frontend, and samples to stacked decoders. The architecture cannot make a poor capture true. It can make the path from probe to claim visible enough to challenge, replay, and improve.
Sources
- sigrok project,
libsigrok.hfrom the released libsigrok 0.5.2 commit —sr_dev_driver, data-feed packet types, and packet payload structures. - sigrok project, “File format: sigrok/v2” — the
.srZIP container, version record, metadata, and captured sample-file specification. - sigrok project, “Protocol decoder API” — Python decoder modules, streamed chunks, output classes, and decoder stacking.
- sigrok project, “Protocol decoder API/Queries” — the version-3 query model and
self.wait()execution boundary. - sigrok project, PulseView
session.hppat commitaf02198— the currentpv::Sessionownership boundary and logic/analog segment state. - sigrok project, “Supported hardware” — development-tree device counts, completeness states, and the release-build caveat.
- sigrok project, “Saleae Logic” — first-generation device channels, sample rate, thresholds, trigger and memory limits, and
fx2lafwsupport. - sigrok project, “Protocol decoders” — the supported decoder count and stack input/output identifiers.
- sigrok project, “sigrok-cli” — driver and channel selection, acquisition limits, saved captures, stacked decoders, and high-throughput guidance.
- sigrok project, “Downloads” — formal component versions, nightly-build guidance, platform packages, firmware, and device-permission notes.
- Elliot Williams, “What's Inside A Neonode Laser Sensor?”, Hackaday, March 6, 2018 — an independent field example of saved sigrok acquisition followed by separate SPI-decoding passes.
- John R. Southern, “E-mu Systems Emulator II memory option board with Saleae Logic analyzer,” Wikimedia Commons, photographed January 22, 2011 — source page for the article's archival photograph.