
Most debuggers make a fragile bargain: reproduce the bug, stop near it, and hope that the next run behaves enough like the last one for yesterday's clues to remain useful. An intermittent failure breaks that bargain. Its thread schedule changes, object addresses move, a signal arrives elsewhere, and the state worth examining disappears with the process.
rr changes the unit of debugging from a live program to a recorded execution. Run the failure once under rr record; then open that trace with rr replay as often as needed. Memory addresses, register values, system-call results and instruction-level control flow return to the same states. The debugger can move backward as well as forward, so an observed bad value becomes the starting point for a search toward the write that produced it.[2][3]
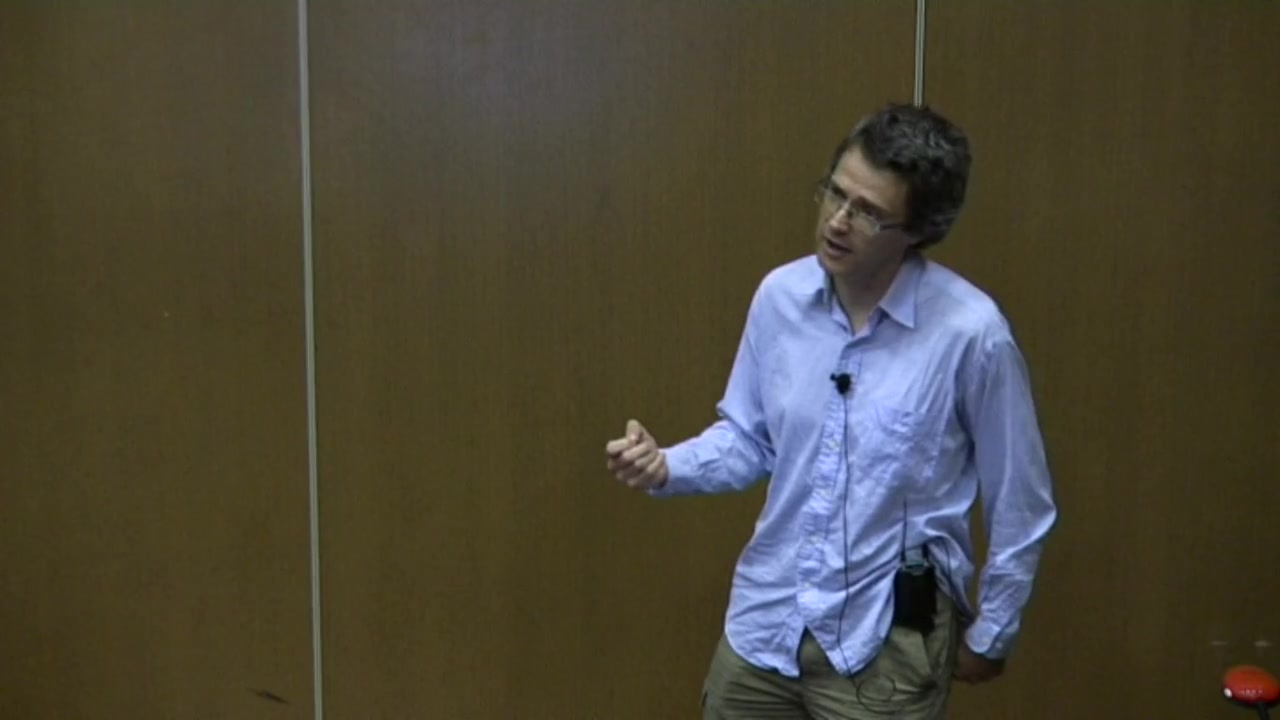
Robert O'Callahan's linux.conf.au 2016 session is valuable because it makes the machinery behind that promise visible. The talk is also a dated engineering snapshot: its x86-only support slide is no longer current, while its single-core model and hardware constraints still define where the tool fits. Watch it as two things at once—an explanation of a remarkably small recording boundary, and a lesson in how Linux features designed for other purposes can be composed into a practical debugger.[1][4]
00:31–06:20 — Draw the recording boundary around user space
The talk opens with a screenful of failed test variants: nondeterminism at a scale where rerunning one configuration is not an investigation strategy. O'Callahan's answer is not to record an entire virtual machine. Around the six-minute mark, his central diagram draws a box around a Linux process tree. Deterministic user-space CPU execution stays inside; system-call results and signals cross the boundary and are recorded.[1]
That boundary is the first idea to retain. During replay, rr does not reconstruct a faithful copy of every kernel object or repeat each external side effect. It recreates the effects that the recorded processes observed. A read can receive the bytes captured during recording; a clock query can return its recorded value; a signal can be delivered at its recorded point. The technical report describes replay as preserving user-space memory, registers and control flow while reproducing only minimal kernel state.[3]
This is why a trace is more than a verbose log. A conventional log stores the events its author anticipated and usually omits the register or memory value the eventual bug demands. An rr trace stores enough nondeterministic input to re-execute the same user-space history, then exposes that history through GDB. The analytical freedom arrives after the failure, when nobody can go back and add another log line.
07:45–11:30 — Make scheduling part of the trace
At about 7:45, the talk turns a list of Linux facilities into a design. ptrace observes system calls and signals. A hardware performance counter measures deterministic progress. seccomp-bpf helps select which calls need an expensive trap. A performance event tells the recorder when a thread blocks in the kernel. None of those mechanisms is a record/replay API; their composition is the product.[1][3]
Shared-memory races create the hardest source of uncontrolled input. If two threads truly run at once on different cores, the order of conflicting memory accesses can depend on details outside the recorder's view. rr removes that source by allowing only one recorded thread to execute at a time. It still schedules and preempts threads, so a race can be captured when the recorded schedule exposes it, but workloads that need sustained parallel execution pay heavily and weak-memory behavior is outside the model.[3][4]
Serializing threads does not make asynchronous events simple. A signal delivered one instruction earlier may change the entire run. rr therefore records where those events occurred and uses a deterministic hardware counter to approach the same point during replay. Registers and additional checks resolve the final position. The important abstraction is not wall-clock time; it is reproducible progress through the recorded instruction stream.[3]
13:40–16:10 — The syscall buffer is the deployability trick
The clean design has an obvious cost. If every common system call stops the tracee, wakes the recorder through ptrace, and then switches back, syscall-heavy applications become unpleasant to record. Around 14:30, O'Callahan shows the optimization that makes rr practical: an injected preload library intercepts selected calls inside the tracee, writes their results into a per-thread buffer, and avoids the normal ptrace round trip.[1][3]
This is not an invitation to let calls escape unrecorded. seccomp-bpf permits the specific syscall instruction used by the interception path while other calls continue to trap. If a supposedly buffered call can block, Linux performance events notify rr so another recorded thread can run. The result is a deliberately narrow fast path whose output still becomes replay data.[3]
The engineering lesson extends beyond debuggers. The expensive reference path establishes correctness; the fast path must preserve the same evidence while bypassing repeated transitions. If a performance optimization quietly changes what can later be explained, it has crossed the abstraction boundary rather than accelerated it.
18:35–22:45 — Reverse debugging searches one fixed history
The payoff appears after the architecture. O'Callahan moves from ordinary GDB inspection to reverse execution. At roughly 22 minutes, a watchpoint on mRect.width combines with reverse-continue to find the earlier assignment that changed the value. That is a much sharper question than setting a forward breakpoint on every possible writer and hoping another run fails in the same way.[1][2]
The processor is not literally executing instructions backward. During replay, rr can restore a checkpoint before the target and re-execute deterministically toward it; efficient searches make commands such as reverse-continue, reverse-next and reverse watchpoints feel like movement through one timeline.[2][3] Stable addresses matter here. Once an investigator learns which object is corrupt, that object's recorded address remains meaningful across repeated replay sessions instead of being invalidated by a fresh allocation layout.
This changes debugging from reproduction to navigation. A core dump supplies one state. A live rerun supplies a different history. An rr trace supplies many inspectable states along the history that actually failed. The Red Hat walkthrough demonstrates the practical rhythm: observe a wrong final value, move back to a suspicious call, place a watchpoint, and continue in reverse until the mutation becomes visible.[6]
23:35–29:10 — Read the limitations as the architecture
The 2016 limitations slide is unusually useful because it exposes the price of each earlier choice: one core, no uncontrolled shared memory with processes outside the recording tree, incomplete syscall coverage, and then-only x86 support. Two of those boundaries remain central. The current project still warns that parallel workloads can slow dramatically under its single-core execution model, and that unsupported syscalls or kernel changes may require new rr work.[2][4]
One boundary has moved. The current repository lists supported Intel and AMD families plus selected AArch64 systems, including Apple Silicon running Linux; virtual machines must expose suitable performance counters.[4] That change should not be read as "any Linux machine." Hardware counters, kernel behavior and the application workload form part of the compatibility contract.
Around 26 minutes, O'Callahan praises Linux for stable, documented kernel/user interfaces and useful file-copy facilities. This is not generic platform enthusiasm. A user-space recorder survives only if it can observe, constrain and reproduce process behavior without carrying a private kernel. The closing wishlist—better process-control APIs and fixes for kernel edge cases—shows that rr remains downstream of those interfaces even while exploiting them creatively.[1][3]
Where rr belongs in an engineering workflow
The strongest adoption case is a supported Linux environment, a native application or test that can run mostly on one core, and a failure whose cause lies within the recorded process tree. Start with a small canary rather than a whole CI fleet: record a representative test, confirm replay, exercise the debugger commands the team already uses, and measure trace size and slowdown on the real workload. Firefox's own documentation shows this pattern through its test harness and uses chaos mode when altered scheduling helps expose an intermittent failure.[5]
Treat the trace as sensitive build output. It can contain process memory and recorded results from file, network and clock operations; access controls and retention should match the data the program handled. Preserve the executable and relevant libraries with the trace or use the project's packing workflow, because deterministic replay depends on the recorded code remaining available.[2][4]
Do not force the tool across its declared boundary. A highly parallel benchmark, GPU-heavy process, unsupported accelerator path, hostile binary or failure rooted in an unrecorded external system may need another technique.[3][4] rr is compelling because it narrows the problem, not because it records the universe. Within that boundary, one failed execution stops being a vanished accident. It becomes an artifact the team can revisit until cause catches up with effect.
Sources
- linux.conf.au 2016, "Record and replay debugging with rr" — official YouTube recording; Internet Archive CC BY 3.0 copy used to source the cover frame.
rrproject, current feature overview, debugging workflow and limitations.- Robert O'Callahan et al., "Engineering Record And Replay For Deployability: Extended Technical Report," 2017.
rr-debugger/rr, current source repository, system requirements and support boundaries.- Firefox Source Docs, "Debugging Firefox with rr," current test-harness and chaos-mode guidance.
- William Cohen, "How to debug C and C++ programs with rr," Red Hat Developer, May 3, 2021.