Dengue is no longer a "once-a-season" vector-control problem. The more useful framing in 2026 is a stacked mechanism: more permissive transmission weather + urban breeding micro-habitats + detection lag + response capacity limits. If all four move in the same direction, case curves steepen faster than traditional campaign cycles can absorb.
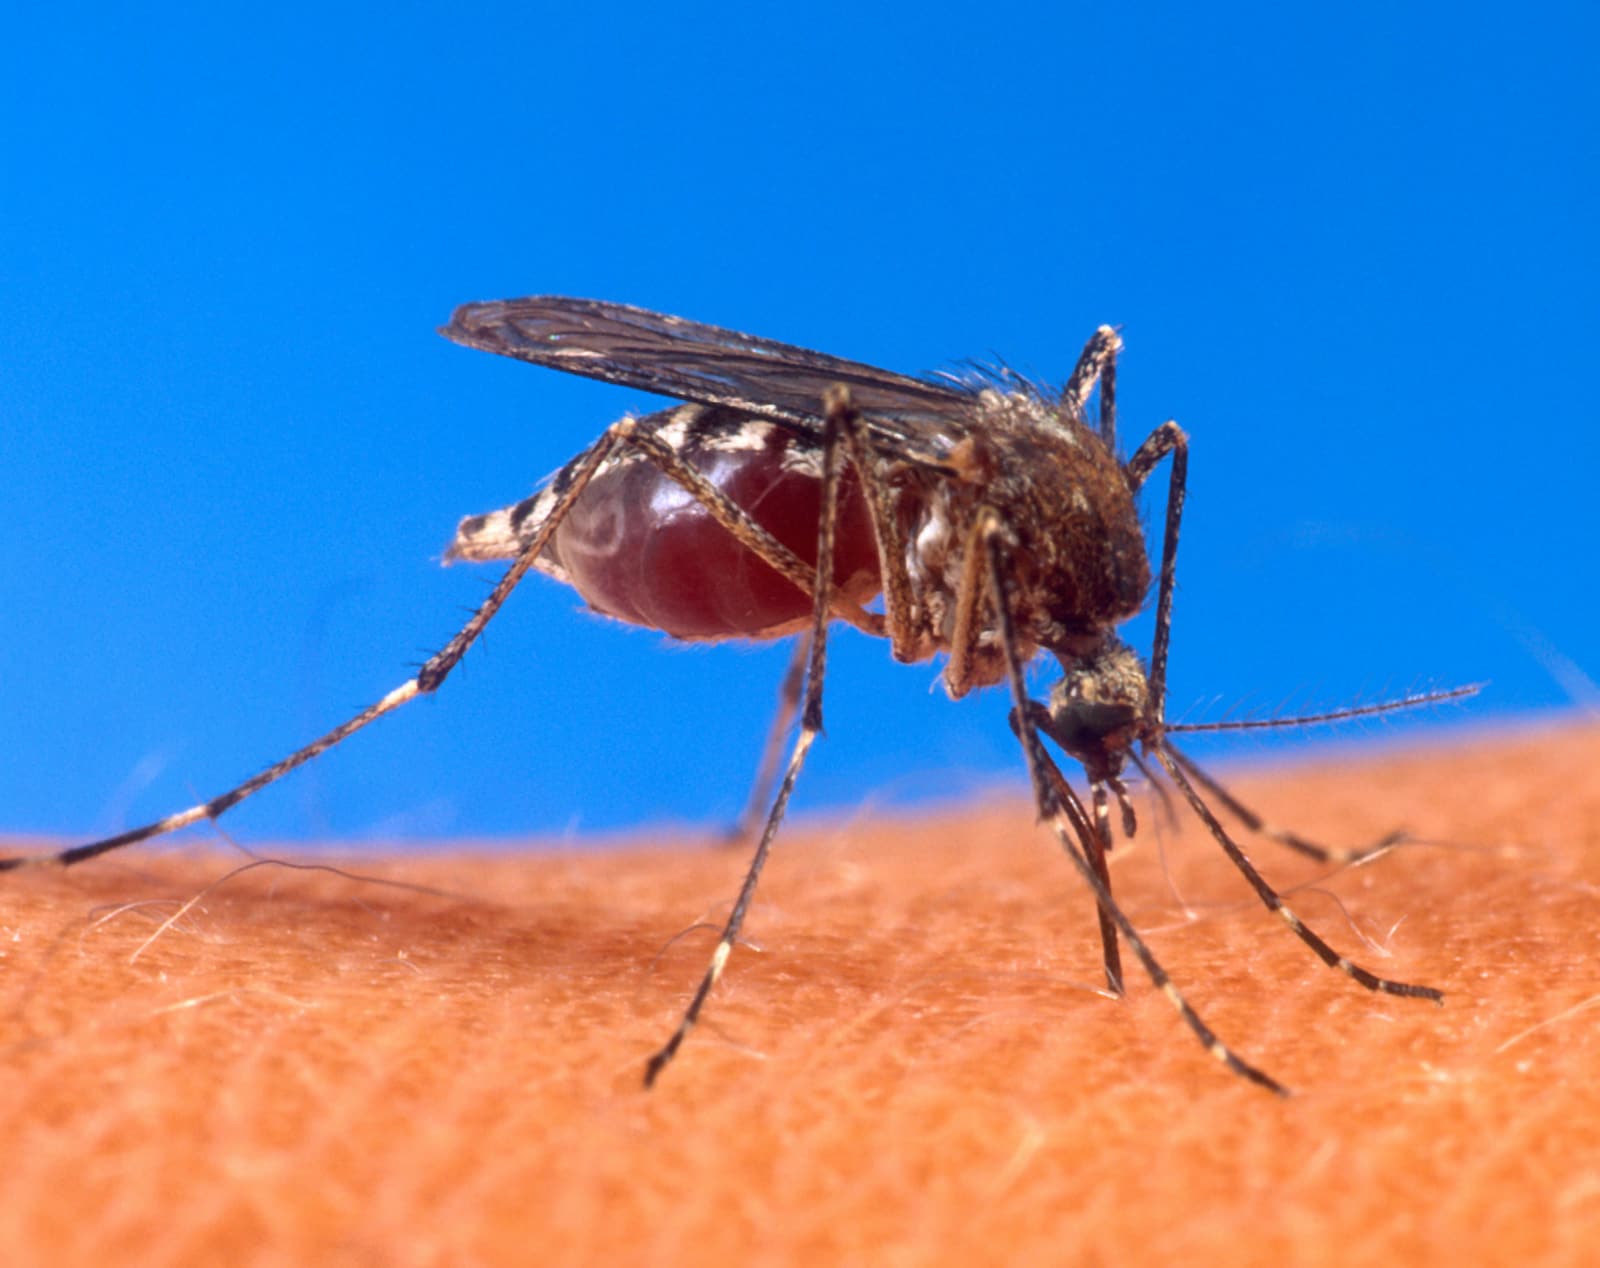
Image context: The header photo shows an Aedes mosquito feeding on human skin—the exact household-level exposure point that makes container control and faster surveillance timing so critical.
Timeline anchors before interpretation
- 2000: WHO received 505,430 reported dengue cases globally.[1]
- 2010 burden estimate: modeling work estimated about 390 million infections/year, with roughly 96 million clinically apparent.[2]
- 2024: WHO recorded a historic high of >14.6 million reported cases and >12,000 deaths.[1]
- January-July 2025: WHO reports >4 million cases and >3,000 deaths across 97 countries.[1]
The directional message is consistent: transmission opportunity is expanding faster than many systems are adapting.
Mechanism step 1: warmer, wetter windows shorten the vector clock
Dengue transmission is constrained by mosquito biology, not headlines. WHO notes the mosquito extrinsic incubation period (EIP) is about 8–12 days at 25–28°C.[1] When local conditions keep vectors alive long enough and temperatures stay in favorable bands, more mosquitoes survive to become infectious.
This does not mean "heat alone causes every outbreak." It means climate and weather move the baseline probability of transmission events upward, especially when rainfall and humidity increase habitat persistence.[1][3]
Mechanism step 2: urban water-storage behavior creates high-yield breeding pockets
In practice, vector control fails at the container level. WHO and PAHO both emphasize that household and neighborhood water-holding environments (storage containers, unmanaged solid waste, intermittent-water coping practices) are core operational drivers of transmission in urban and semi-urban settings.[1][4]
That creates a structural asymmetry:
- breeding sites can reappear within days;
- control teams often run on weekly or campaign cadence;
- neighborhood heterogeneity means citywide averages hide hotspot blocks.
So even when aggregate mosquito indices look "manageable," localized abundance can still sustain rapid spread.
Mechanism step 3: surveillance lag lets explosive clusters form before control catches up
Dengue symptoms often begin 4–10 days after infection, and many infections are asymptomatic or mild.[1] CDC also highlights that only a minority of infections become clinically obvious (roughly 1 in 4 symptomatic).[5] Operationally, this means reported cases are a delayed and incomplete reflection of transmission already underway.
By the time severe cases arrive, the local force of infection may have been rising for multiple mosquito generations. In other words: outbreak dashboards are frequently rear-view mirrors.
Mechanism step 4: response systems saturate during synchronized regional waves
Large concurrent outbreaks stress diagnostics, triage, vector operations, and risk communication at once. WHO explicitly links recent expansion to fragile health systems, surveillance limitations, and population movement, alongside climate and vector spread.[1]
Once system load crosses a threshold, response quality becomes uneven:
- slower case confirmation;
- delayed targeted spraying/source reduction;
- weaker follow-through in high-mobility neighborhoods;
- lower trust when public messaging changes mid-wave.
This is how manageable transmission becomes a prolonged urban wave.
Two strongest interpretations, and where each is right
Interpretation A: climate is now the dominant driver
Strong point: climate variability and warming are clearly widening suitable transmission windows and geographic reach.[1][3]
Boundary: climate does not determine block-level outcomes by itself. Places with strong primary care access, timely diagnostics, and disciplined container control can still blunt severe-wave growth.
Interpretation B: governance and delivery are the real bottlenecks
Strong point: most actionable levers are local—water reliability, waste removal, surveillance timeliness, and fast neighborhood interventions.[1][4]
Boundary: governance improvements alone still operate under harder environmental baselines than in prior decades.
Both interpretations are useful. One explains why baseline risk is rising; the other explains why outcomes diverge city to city.
What would change this assessment
This mechanism-first thesis weakens if, over multiple seasons, we observe all three together:
- sustained decline in outbreak size despite similar climate suitability,
- faster symptom-to-confirmation intervals in high-burden districts,
- measurable reduction in container-breeding indices at neighborhood level, not just city averages.
Without those shifts, annual emergency cycles will keep repeating with higher peaks.
Practical reading for 2026
Treat dengue as an operations-timing disease, not just a mosquito-presence disease. The highest-yield interventions are those that reduce lag (diagnosis and reporting), narrow hotspot uncertainty (sub-city surveillance), and cut breeding persistence between campaign rounds. Where those timings improve, severe-case curves usually bend before public attention does.
Sources
- WHO Fact Sheet — Dengue (updated 2025)
- Bhatt S, et al. The global distribution and burden of dengue (Nature, 2013; PMID: 23563266)
- Lambrechts L, et al. Impact of daily temperature fluctuations on dengue virus transmission by Aedes aegypti (PNAS, 2011)
- PAHO Topic Page — Dengue (clinical phases, seasonality, and control context)
- CDC — Dengue (clinical and prevention overview, 2025 update)
- ECDC — Mosquito maps (vector expansion and distribution context)