Priced: from August 28 to September 1, West Texas Intermediate spot crude rose from $84.57 to $91.48 a barrel, an 8.2% move, and New York Harbor ultra-low-sulfur diesel rose from $4.351 to $4.724 a gallon, or 8.6%, while New York Harbor conventional gasoline fell from $3.527 to $3.203 a gallon, or 9.2%.[3] New: the latest U.S. balance shows refineries processing 17.5 million barrels a day at 98% utilization, yet gasoline stocks were 6% below their five-year average and distillate stocks were 14% below, so the next price test is not simply whether refiners can run more crude but whether a high-run system can make, retain, and place the particular products the market needs.[1]
That is a narrower claim than “the United States is running out of fuel.” Gasoline inventories fell in the latest week, but distillate inventories rose. Four-week product supplied—EIA's measure of petroleum leaving the primary supply system—was weaker than a year earlier.[1][4] The mismatch can persist without a demand boom, but weak demand is also the strongest reason it may close.
Evidence cut-off: September 4, 2026, 03:40 UTC. The weekly balance covers the week ending August 28; EIA's daily spot table runs through September 1. Weekly figures are estimates and may be revised. Percentage changes in the opening paragraph are calculations from EIA's published levels. This is market-mechanism analysis, not individualized investment advice.[1][2][3][4]
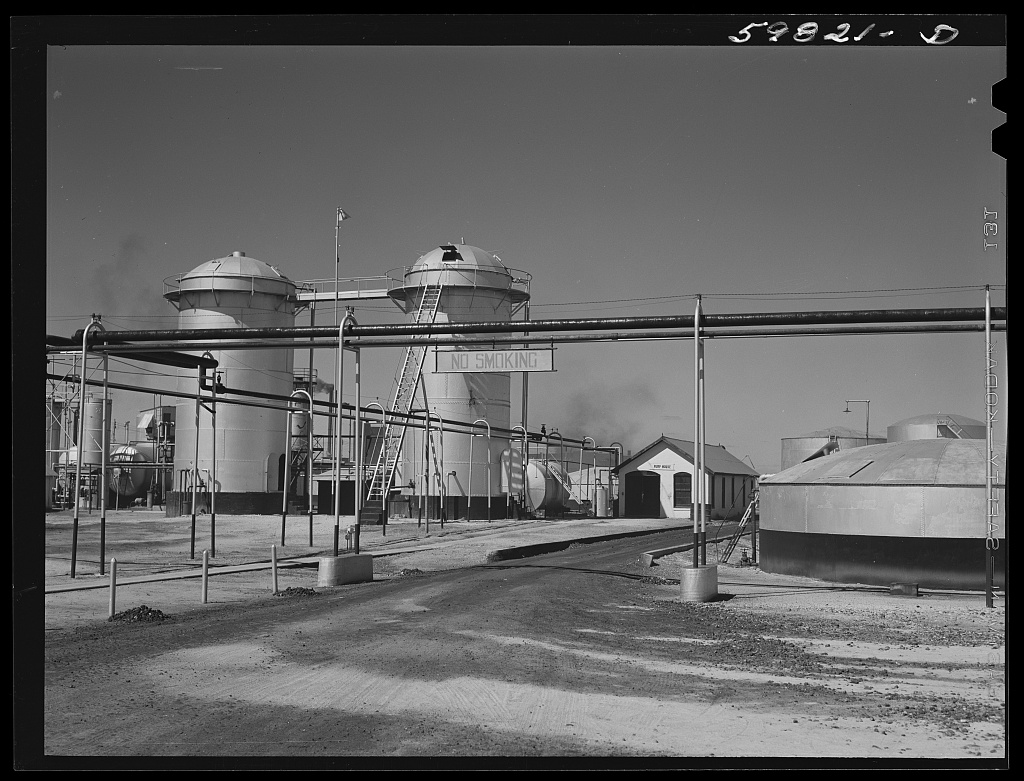
Image context: the cover is a real Library of Congress photograph of a Wichita refinery in October 1941. It does not show today's refinery fleet or the week measured here. Its role is archival: tanks, pipes, and processing equipment are a reminder that “utilization” describes a physical conversion system, not a promise to deliver any one fuel.[7]
Ninety-eight percent is a throughput number
The utilization headline sounds like a speedometer pressed against its stop. Its construction is more specific. EIA divides refinery gross inputs by the latest reported operable atmospheric crude-distillation capacity. The numerator includes crude oil and other feedstocks; the denominator comes from monthly capacity data and can lag the weekly numerator.[2][4] National utilization is therefore not the share of every refinery unit that is available, nor the percentage of capacity devoted to gasoline or diesel.
That distinction is the mechanism behind this wrap. A refinery accepts a feedstock barrel and produces a slate: gasoline blendstocks, distillates, jet fuel, residual products, petroleum coke, and other outputs. Hardware, crude quality, product specifications, blending components, maintenance, and economics constrain that slate. More crude input can increase total output while leaving the marginal shortage in the wrong product or region.
The latest week illustrates the boundary. Crude inputs reached 17.496 million barrels a day, up 102,000 from the week before. Gasoline production averaged 9.8 million barrels a day, while distillate production slipped to 5.1 million.[1][2] The 98% reading does not establish a hard physical ceiling—one regional rate in the same table exceeded 100% because the numerator can outrun the lagged capacity denominator.[2][4] It does show that gross inputs were high relative to reported operable capacity. Yield choices and the destination of finished barrels remain separate questions.
The stock direction and the stock level disagree
Gasoline inventories fell 1.2 million barrels to 205.7 million in the week ending August 28. That left them 6% below the five-year average. Distillate inventories moved the other way, rising 0.8 million barrels to 104.2 million, but remained 14% below their five-year average.[1][2]
The weekly arrows alone would say gasoline tightened and distillate eased. The levels say the deeper cushion is still missing in distillate. Both statements can be true: one week measures the latest flow, while the comparison with the five-year average describes the inventory inherited from many earlier flows.
This matters for price interpretation. A build from a low base is not the same as a comfortable stock, just as a draw from a normal base is not automatically a shortage. Here, gasoline has both a weekly draw and a below-normal level. Distillate has a weekly build but the larger relative deficit. These are EIA-reported commercial stocks in the primary supply chain; they exclude secondary storage at bulk plants and retail dealers as well as fuel held by end users.[2][4] The measured balance is tight enough to watch, not strong enough to call a generalized fuel shortage.
Six anchors define the setup
- The price split: WTI gained 8.2% and New York Harbor ultra-low-sulfur diesel gained 8.6% between August 28 and September 1, while New York Harbor conventional gasoline fell 9.2%, based on EIA spot observations.[3]
- The run rate: crude inputs were 17.496 million barrels a day and national utilization was 98%.[1][2]
- Gasoline: stocks were 205.7 million barrels, down 1.2 million for the week and 6% below the five-year average.[1][2]
- Distillate: stocks were 104.2 million barrels, up 0.8 million for the week but 14% below the five-year average.[1][2]
- Implied demand: four-week total product supplied averaged 20.449 million barrels a day, 3.9% below a year earlier; gasoline was down 1.6% and distillate down 6.0%.[2]
- The export split: four-week motor-gasoline exports averaged 882,000 barrels a day, essentially flat from 885,000 a year earlier, while distillate exports rose 30.5% to 1.765 million barrels a day.[2]
The first four anchors describe a divided market: crude and diesel rose, gasoline fell, refinery inputs ran high, and both product cushions were thin. The last two explain why one story cannot fit both fuels. Implied disappearance weakened, while exports were flat for gasoline and sharply higher for distillate.
Exports split the explanation
The four-week export data make a product-specific distinction. Total motor-gasoline exports were almost unchanged from a year earlier. Distillate exports rose from 1.352 million to 1.765 million barrels a day, a 30.5% increase.[2] Exports are therefore a plausible part of the distillate bridge between high refinery runs and a low inventory cushion. The same explanation does not fit gasoline.
Even that split does not prove causation. EIA estimates exports, and its total-motor-gasoline category includes blending components. Imports, production, exports, stock changes, and implied demand all shape each balance.[2] What the figures establish is a boundary: refinery output is not synonymous with product added to EIA-reported commercial inventories. Geography adds another layer. EIA's regional table shows different utilization rates across the five petroleum districts, so the national 98% cannot reveal whether the right molecule is near the right market.[2]
That makes “run the refineries harder” an incomplete answer. The headline utilization rate cannot reveal idle capacity in each conversion unit or show how a change in gross inputs would map to individual products.[4] Whether lower gross inputs become bullish depends on the starting inventory by product, the yield mix of the units still operating, trade flows, and how quickly demand steps down.
The price split is the message
WTI and New York Harbor diesel rose by similar percentages over the measured two-session interval, while conventional gasoline at the same harbor fell 9.2%.[3] That divergence is more informative than a generic “oil up” label: the product complex did not trade as one barrel. It does not, by itself, isolate refinery scarcity. The series use different physical units, represent different commodities or specifications, and do not constitute a calculated refining margin.
Nor does two days establish that either inventory gap is newly embedded in price. Crude can move on global supply expectations, while gasoline and diesel each reflect product, specification, location, and seasonal conditions. Gasoline's decline despite a weekly stock draw is a warning against reading one national inventory statistic straight through to price. The useful inference is modest: the latest balance arrived in a market already distinguishing sharply among crude, gasoline, and diesel. If product stocks fail to rebuild as gross inputs step down, that dispersion can persist; if they rebuild, the late-summer split can unwind without a broader shortage.
Strongest counterweight: implied demand is already weaker
The cleanest objection sits in the same weekly report. On a four-week basis, total product supplied was down 3.9% year over year. Finished gasoline supplied was down 1.6%, and distillate supplied was down 6.0%.[2] A system facing softer disappearance may not need this run rate to rebuild stocks. If demand falls faster than refinery runs during the transition out of summer, today's below-normal inventories can prove seasonal rather than structural.
There is also a measurement boundary. “Product supplied” is calculated from primary supply data; it is often called implied demand, but it is not a direct register of final retail consumption. Weekly estimates combine reported samples, imputation, models, and lagged monthly information. EIA says the sampled companies generally account for about 90% of volumes in the relevant populations.[4] The year-over-year declines are meaningful signals, not exact readings of what motorists, airlines, farms, or factories consumed that week.
The distillate build strengthens this counterweight. Inventories rose despite lower reported production in the latest week.[1] One build cannot erase a 14% gap, but repeated builds alongside weak supplied volumes would do so. That is why the thesis is a product-mix test rather than a shortage declaration.
Falsifier
Discard the current product-mismatch concern if, by the September 23 weekly release, gasoline's deficit to its five-year average narrows to 3% or less and distillate's narrows to 10% or less, while four-week total product supplied remains at least 3% below its year-earlier level. That combination would show that soft demand and intervening flows can repair the cushions even if utilization steps down.
The opposite outcome would keep the thesis alive: utilization steps down and implied demand remains weak, yet the relative inventory deficits fail to narrow—or widen. Then neither softer disappearance nor the late-summer run rate is closing the relative gaps, making yield, trade, geography, or outages the more consequential marginal variables.
The market has marked up crude and diesel while marking gasoline down. The new information is that gross inputs were high relative to reported capacity before gasoline and distillate cushions normalized. The actionable distinction is not “more barrels” versus “fewer barrels.” It is whether the system can turn its next barrel into the right product, retain it in the reported commercial balance, and deliver it to the region that needs it before weak demand closes the gap on its own.
Watchlist
- September 9 — Short-Term Energy Outlook: test whether EIA changes its product-price, demand, refinery-run, or inventory path after the latest crude and diesel repricing.[6]
- September 10 — Weekly Petroleum Status Report: the holiday-delayed release is the first check on whether gasoline starts rebuilding, distillate extends its one-week build, and gross inputs remain high relative to reported capacity.[5]
- September 23 — Weekly Petroleum Status Report: apply the falsifier after three more weekly observations; compare relative inventory gaps with four-week product supplied rather than treating one build or draw as a verdict.[5]
- October 6 — Winter Fuels Outlook: the first winter-focused outlook should clarify how EIA connects the distillate cushion, refinery runs, prices, and heating demand.[6]
Sources
- U.S. Energy Information Administration, archived “Weekly Petroleum Status Report Highlights” released September 2, 2026 — refinery inputs and utilization, production, weekly inventory changes, five-year comparisons, and four-week product supplied.
- U.S. Energy Information Administration, archived “Weekly Petroleum Status Report” released September 2, 2026 — U.S. balance sheet, commercial inventories, product-specific exports, product supplied, refinery inputs, capacity, and regional utilization.
- U.S. Energy Information Administration daily series histories preserving the August 28 and September 1, 2026 spot observations: WTI at Cushing, New York Harbor conventional gasoline, and New York Harbor ultra-low-sulfur diesel
- U.S. Energy Information Administration, “Weekly Petroleum Status Report Explanatory Notes and Detailed Methods Report” — product-supplied definition, sampling, estimation, revisions, and refinery-utilization methodology.
- U.S. Energy Information Administration, “Weekly Petroleum Status Report Schedule” — standard Wednesday schedule, September 10 Labor Day delay, and release times.
- U.S. Energy Information Administration, “Short-Term Energy Outlook Release Schedule” — September 9 STEO and October 6 Winter Fuels Outlook dates.
- Library of Congress catalog permalink for item 2017809315, “Barnsdall oil refinery. Wichita, Kansas” — Marion Post Wolcott's October 1941 FSA/OWI photograph, digital ID fsa.8c16525, with no known restrictions.