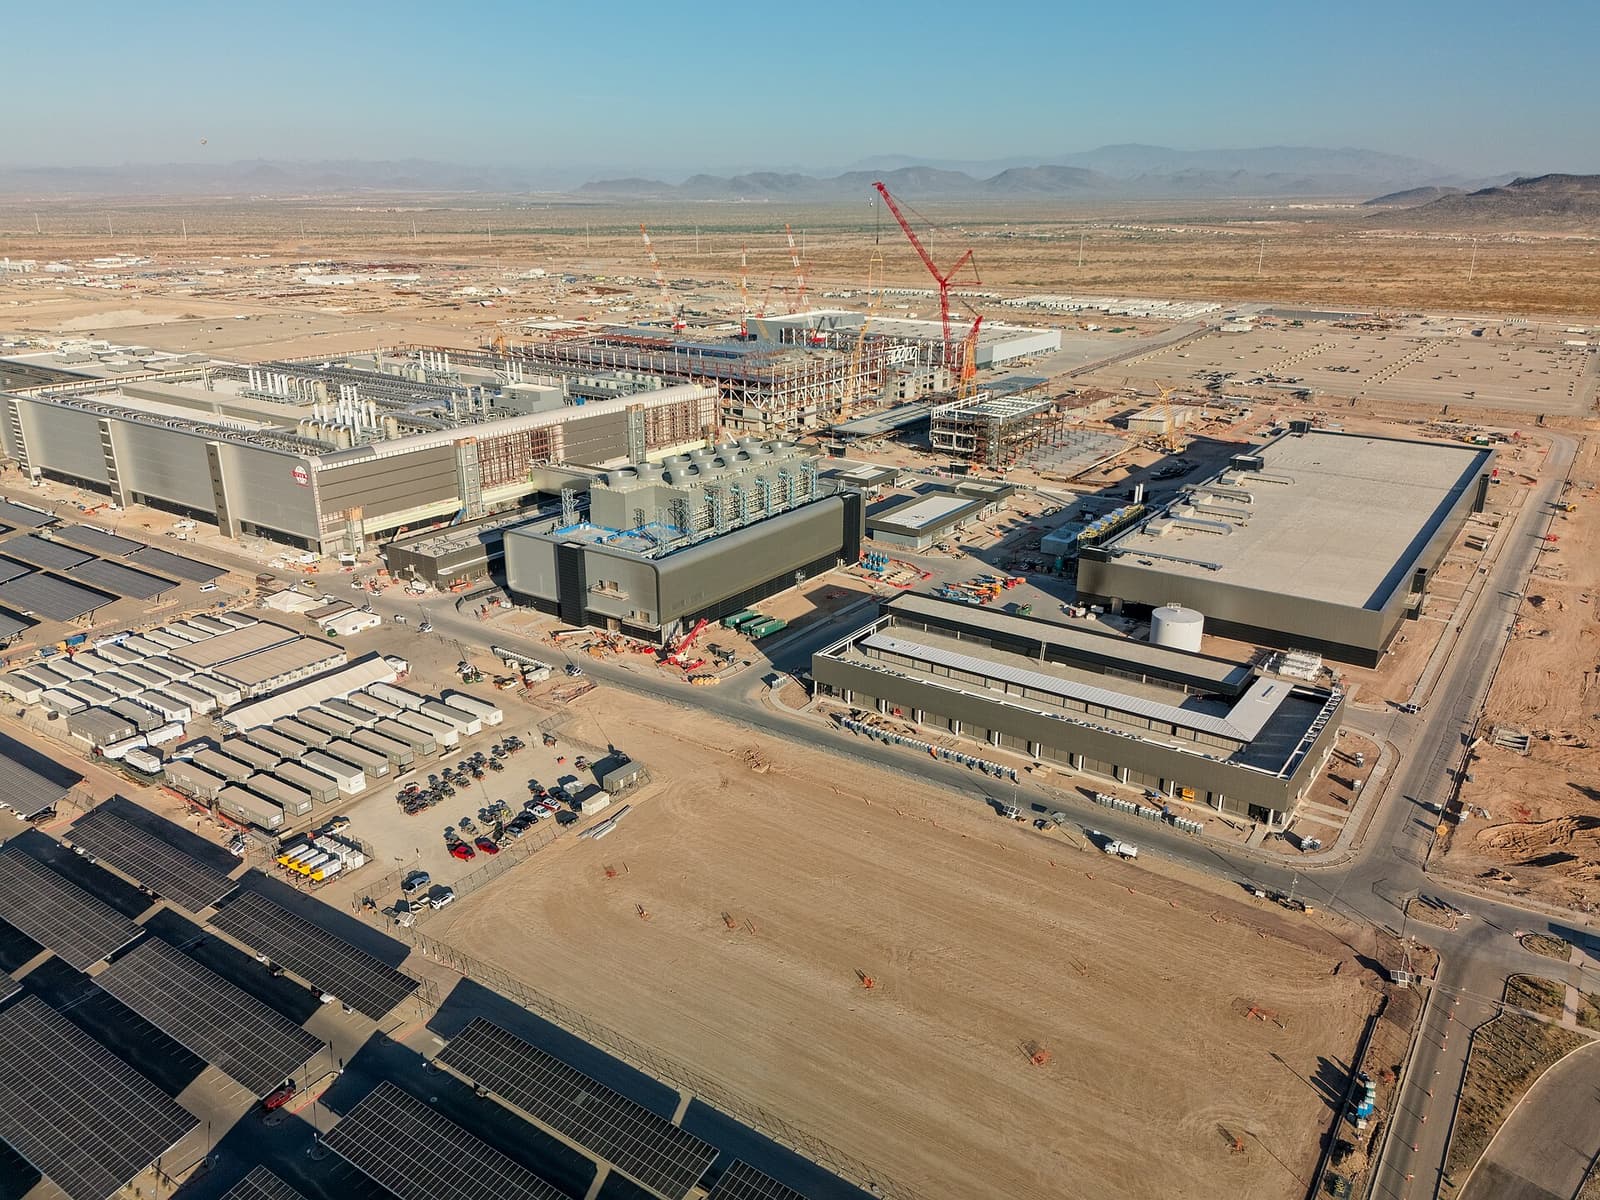
Priced: a $232.2 billion year of new foreign-direct-investment expenditure, up 49.5%, reads like a fresh wave of factories and equipment. New: $218.4 billion went to acquisitions of existing U.S. businesses—roughly 94 cents of every dollar—while establishments and expansions, the greenfield ledger, received $13.8 billion.[1][2]
That does not make the rebound hollow. It makes it easy to misprice. An acquisition can preserve a company, connect it to a global distribution network, and finance investment after closing. But it is not the same economic event as pouring concrete, installing a production line, or opening a warehouse. For the capacity story, the decisive number is the $66.1 billion total plan for greenfield projects initiated in 2025—and how much of that plan becomes actual expenditure.[1][3]
Evidence cut-off: August 17, 2026, 05:36 UTC. “Priced,” the scenario branches, and the falsifier are this article's interpretation rather than BEA, OECD, or Census labels. This is not investment advice.
One headline, three different transactions
BEA's “new foreign direct investment” series combines acquisitions, establishments, and expansions. All three require a direct-investment relationship: a foreign investor must hold at least 10% of the voting securities of a U.S. enterprise, a threshold that can represent significant influence rather than corporate control. This is therefore distinct from an ordinary portfolio position.[2]
The three categories do different work. An acquisition begins when a foreign entity crosses that ownership threshold in an existing U.S. business. An establishment creates a new U.S. legal entity. An expansion adds a new facility to an existing foreign-owned U.S. affiliate. BEA groups establishments and expansions together as greenfield investment.[2]
One measurement boundary matters before comparing them. BEA's expenditure statistic includes the total acquisition or project cost whether financing came from domestic or foreign sources. Its separate financial-transactions series counts only funds obtained from the foreign parent group. The $232.2 billion is therefore not a cross-border capital-inflow total; this article uses it to read transaction type and project conversion.[4]
That taxonomy is the mechanism behind the thesis. Acquisition expenditure records the cost of obtaining a qualifying ownership stake in assets and operations that already exist; it does not by itself establish either corporate control or new capacity. Greenfield expenditure is more directly tied to adding a business or facility. The OECD makes the same analytical separation: greenfield investment and capacity extensions are expected to increase productive capacity, while mergers and acquisitions can deliver technology, supply-chain access, or rescue capital but may also make headline FDI unusually volatile because individual transactions can be very large.[5]
The distinction also prevents two common reading errors. First, BEA reported that manufacturing absorbed just over half of 2025's total new-investment expenditure. That describes the industry of the U.S. affiliate; it does not say that half of the national total purchased new manufacturing equipment. An investor can acquire an operating chemical company and place the entire transaction in the manufacturing column without building a new plant in the first year.[1][2]
Second, employment attached to an acquired enterprise is not automatically employment created by the acquisition. BEA reports current employment at newly acquired businesses alongside planned employment for establishments and expansions. Those measures are useful, but they answer different questions. Existing payroll belongs to a business that entered a qualifying foreign direct-investment relationship; a planned facility's payroll exists only if the project reaches operation.[1][2]
The conversion ledger
The first-year arithmetic is clean. Total expenditure rose sharply, acquisitions took almost all of it, and greenfield activity remained the small residual. The forward arithmetic needs more care. BEA's $66.1 billion greenfield plan includes both first-year spending and intended future spending; it is a total project plan, not another $66.1 billion waiting on top of the $13.8 billion already recorded.[1]
That leaves a conversion question, not an announcement question. Planned expenditure can move through land purchase, design, permitting, utility interconnection, construction, equipment installation, and commissioning over several years. It can also be resized, delayed, or cancelled. A press release records intent. BEA's follow-through tables record actual greenfield spending by the year in which a project was initiated and the year in which money was spent, which is the better bridge from promise to deployed capital.[3]
For investors, the distinction changes which cash flows the headline can support. Acquisition-heavy expenditure can benefit selling shareholders, advisers, and lenders immediately. Broad construction, industrial equipment, logistics, and local-utility demand require the greenfield plan to move farther down the physical chain. Treating the whole $232.2 billion as current factory capex pulls those later cash flows into the present.
Base case: a real pipeline, converted slowly
The base case is that the 2025 plan is genuine but uneven. Large industrial projects normally spend across multiple reporting periods, while the acquisition total can jump in a single closing. Establishment and expansion outlays should therefore rise as projects advance, yet acquisitions can remain the largest annual category even during a visible factory-building cycle.
Under this path, the best evidence will arrive in layers. Census construction data should show work put in place in private manufacturing, because that series measures construction performed on U.S. structures rather than announced project value. BEA's next annual survey should then show more spending against projects initiated in prior years. Neither series identifies the same universe—Census covers construction regardless of investor nationality, while BEA isolates projects involving foreign direct investors—but agreement in direction would strengthen the capacity reading.[3][6]
This base case keeps the headline's optimism while moving its timing. Foreign investors undertook a substantial volume of acquisitions and greenfield projects in the United States in 2025, but BEA's total-cost measure does not say how much financing crossed the border. The productive-capacity payoff is a multiyear conversion, not something proved by the first-year aggregate.[1][4]
Upside: planned projects become concrete and equipment
The upside branch begins when establishment and expansion expenditure accelerates faster than acquisitions and the physical data confirm it. Success would show up as sustained private-manufacturing construction, followed by equipment orders, facility openings, and operating payroll rather than repeated extensions to completion dates.
That path would make the initial headline more durable. Acquisitions would still matter, but the mix would migrate from purchasing claims on existing earnings toward creating new production and logistics capacity. The $66.1 billion plan would then become a leading indicator rather than a soft ceiling.
The important word is sustained. One semiconductor fab, battery plant, or warehouse can dominate a state or industry table. A broader capacity cycle requires conversion across projects and months, not a single photogenic site.
Downside: the deal year does not repeat
The downside branch is not that foreign investors vanish. It is that a few large acquisitions made 2025 look more powerful than the underlying construction pipeline. If financing costs, trade policy, permitting, power availability, or weaker end demand defer greenfield plans, the first-year total can fall even while previously announced projects continue at a slower pace.
This is where acquisition-heavy data become treacherous for trend extrapolation. A large purchase of an existing-business stake can close at once and may not recur the next year. Productive capacity, by contrast, accumulates through many smaller invoices. A softer future headline could therefore mean fewer mega-deals, not an abrupt stop in factory work. Equally, a firm headline driven by another takeover would not prove that greenfield conversion improved.[3][5]
The strongest counterweight: ownership can change operations
It would be equally wrong to call the $218.4 billion acquisition ledger “only paper.” A foreign investor may bring lower-cost capital, export channels, technical know-how, procurement scale, or a reason to keep an acquired plant open. OECD guidance explicitly warns against treating mergers and acquisitions as mere ownership shuffles: their operating benefits can be significant even when immediate capacity creation is less visible than in a new facility.[5]
Nor is every greenfield dollar automatically superior. A new, capital-intensive facility can import much of its equipment, remain weakly connected to local suppliers, or run below capacity. An acquired business with an established workforce and supplier base may spread knowledge more quickly. The article's claim is narrower: transaction type determines what the first-year expenditure proves. Acquisitions prove demand for ownership stakes large enough to qualify as direct investment. Establishments and expansions more directly prove additions to U.S. productive capacity.
Falsifier
The historical split cannot be falsified; it is reported arithmetic. The forward view—that greenfield conversion will be slower and more informative than the acquisition-led headline—is falsified if BEA's 2026 survey shows establishments and expansions becoming the majority of new-investment expenditure, its project-vintage tables show the 2025 plan converting broadly, and Census reports consecutive increases in private-manufacturing construction. That combination would mean the mix had already rotated from acquisitions to physical capacity faster than the base case allows.[1][3][6]
Watchlist
- September 1 — July construction spending: check private manufacturing work put in place, not total construction, for the first near-term confirmation of physical conversion.[6][7]
- October 1 — August construction spending: require a second print in the same direction before treating one month as a trend.[6][7]
- June 2027 — BEA's 2026 new-investment release: compare acquisitions with establishments and expansions, then use the supplemental project-vintage tables to see how 2025 plans translated into later expenditure.[1][3]
The $232.2 billion rebound records costly acquisitions, establishments, and expansions involving foreign direct investors. Because BEA counts total cost regardless of funding source, it does not say that the same amount crossed the border—or that the same amount became new productive capacity. That capacity claim belongs to the greenfield conversion ledger, where plans meet concrete, equipment, and time.[2][4]
Sources
- U.S. Bureau of Economic Analysis, “New Foreign Direct Investment in the United States, 2025” — first-year expenditures, transaction mix, industries, employment, planned greenfield spending, and next release.
- U.S. Bureau of Economic Analysis, “New Foreign Direct Investment in the United States Release—Additional Information” — direct-investment threshold and definitions of acquisitions, establishments, expansions, and greenfield investment.
- U.S. Bureau of Economic Analysis, “Supplemental Data: New Foreign Direct Investment in the United States” — actual-versus-planned expenditure tables and project-vintage tracking.
- U.S. Bureau of Economic Analysis, “What is the relationship between BEA's new investment statistics and its other statistics on foreign direct investment in the United States?” — total investment cost, domestic-versus-foreign funding, and the financial-transactions boundary.
- OECD, Benchmark Definition of Foreign Direct Investment, fifth edition, chapter 9, “FDI by type” — capacity effects, M&A counterweights, and interpretation boundaries.
- U.S. Census Bureau, Construction Spending — Methodology — target population, monthly value put in place, and private-manufacturing coverage.
- U.S. Census Bureau, “Construction Spending — Release Schedule” — September 1 and October 1, 2026 publication dates for July and August construction put in place.
- Hunter Trick via Wikimedia Commons, “231105-1 TSMC Fab 21 construction” — aerial photograph made in Phoenix on November 5, 2023.