Priced: toll-road operators already get credit for inflation-linked concessions, scarce corridors, and high incremental margins. New: the 2025-26 data say the better valuation question is not whether tolls can rise, but whether traffic mix, managed-lane time savings, and political tolerance let those increases reach cash flow without leaking trips.[1][2][3][4]
That distinction matters because toll roads look simple only from far away. The asset is a strip of pavement with a concession contract, but the equity value is a live negotiation among commuters, freight operators, regulators, debt markets, and alternative routes. A toll increase that preserves traffic is operating leverage. A toll increase that pushes drivers away, triggers relief programs, or forces new capital promises is just borrowed pricing power.
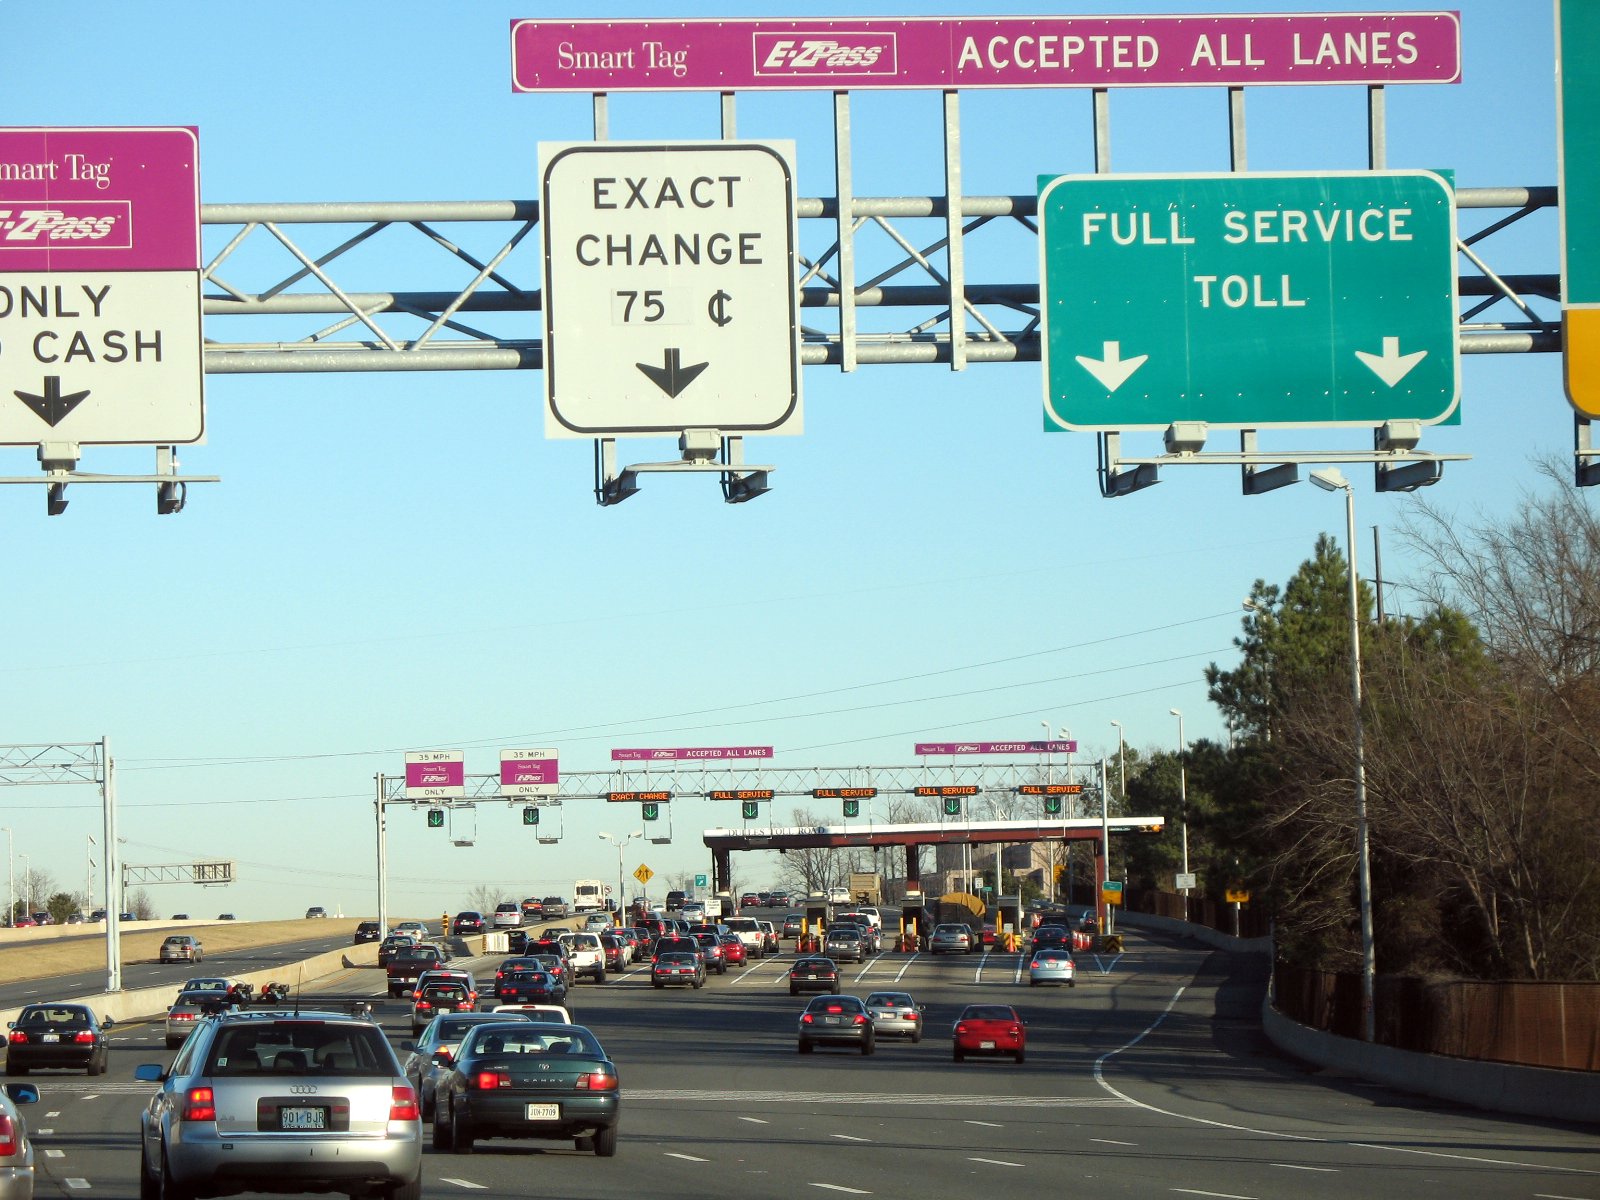
The cover photograph is a Dulles Toll Road plaza just before rush hour, which is the right visual frame for the piece: the finance question lives in repeated trips, priced lanes, collection systems, and the driver's decision to pay for time.[6]
The Mechanism
The clean toll-road model has three parts. First, demand is local and repetitive: the same commuters, airport users, freight carriers, and logistics routes come back because the road saves time. Second, the contract often includes tariff formulas, dynamic pricing, or regulated escalation. Third, the cost base does not rise one-for-one with each trip, so a healthy traffic tape can turn small revenue gains into large EBITDA gains.
Transurban's FY25 presentation shows the attractive version of that mechanism. Proportional toll revenue reached A$3.732 billion, up 5.6%, while proportional operating EBITDA reached A$2.848 billion, up 7.4% on a restated basis.[1] Traffic did not need to boom for that to work: group average daily traffic rose 2.2%, with North America up 6.4% and mature Australian markets growing more slowly.[1] That is why the sector gets a premium. A little volume, some toll escalation, and controlled operating costs can compound.
The same pattern appears in VINCI Autoroutes. Traffic on the French motorway network rose only 0.9% in 2025, with light vehicles up 0.9% and heavy vehicles up 0.7%. Yet revenue rose to EUR6.7 billion, and EBITDA was EUR4.8 billion, equal to 71.0% of revenue.[2] A mature motorway concession does not need software-like growth to produce software-like margins. It needs stable traffic, enforceable tariff mechanics, and no major concession reset that takes away the economics.
The Valuation Walkthrough
The base valuation case should start with toll revenue quality, not with total vehicle miles. A generic road-volume forecast is useful background, but toll roads earn from specific corridors where the user is buying time, reliability, and access. The FHWA-sourced FRED series put U.S. vehicle miles traveled at 293.209 billion miles in May 2026 and the moving 12-month total at roughly 3.335 trillion miles.[5] That is a vast traffic pool, but it does not automatically make every toll asset more valuable. The investable spread is local congestion plus willingness to pay.
Managed lanes make the spread visible. Ferrovial reported 2025 Highways revenue of EUR1.4 billion and adjusted EBITDA of EUR990 million, with North American assets driving the result.[3] The detail that matters is the split between transactions and revenue per transaction. In its U.S. Express Lanes, NTE transactions fell 4.7% while revenue per transaction rose 13.4%; I-77 transactions fell 2.0% while revenue per transaction rose 24.7%; I-66 had both transaction growth and a 13.3% revenue-per-transaction gain.[3]
That is not ordinary traffic beta. It is price discovery on congestion. If the lane saves enough time at the right hour, revenue per trip can rise even when trip count is flat or down. The valuation upside is that these roads can behave like scarce capacity in a bottleneck. The valuation risk is that the same pattern can hide elasticity until a recession, fuel spike, work-from-home shift, or political intervention exposes it.
The 407 ETR is the cleaner mature example. The Greater Toronto Area highway spans 108 kilometres, is fully electronic, and reported 2025 revenue of C$2.0085 billion and EBITDA of C$1.6869 billion.[4] Ferrovial's release said 407 ETR vehicle kilometres traveled rose 6.1% and revenue per trip rose 11.7% in 2025.[3] That is the ideal mix: more use and more revenue per use. If that combination keeps holding, a high multiple is not just a yield story; it is a scarcity story.
Where The Spread Can Break
The weak version of the bull case treats inflation escalation as enough. It is not. A toll formula can raise nominal prices, but customers do not experience the formula. They experience the bill, the trip, the alternative route, and the politics around fairness.
Three failure points matter. The first is mix. Heavy vehicles, airport trips, and peak-hour commuters usually carry more economic value than casual off-peak car trips. If heavy-vehicle growth fades or airport-linked traffic softens, revenue quality can weaken before headline average daily traffic looks alarming. The second is affordability. 407 ETR's expansion of its Route Relief Program to provide up to eight free trips a month to qualifying low-income drivers from January 1, 2026 is not a financial problem by itself, but it is a reminder that successful toll roads still operate inside a public legitimacy boundary.[4] The third is capex. New lanes, tunnels, gantries, safety upgrades, and end-of-concession works can be value-accretive, but they also convert pricing power into obligations.
This is why mature-margin numbers need a haircut when contract uncertainty rises. VINCI's 2025 release noted Escota end-of-concession work approval and a Cofiroute investment addendum funded by specific price increases.[2] Those are not bad events; they are the normal bargain of concession economics. The operator gets a tariff path or extension logic, and the grantor gets investment, maintenance, or mobility commitments. Equity holders should underwrite both sides.
The Counterweight
The strongest counterargument is that good toll roads are not simply charging for pavement. They are selling certainty. A commuter who saves 15 or 20 minutes at the right point in the day may keep paying even when the nominal toll looks high. Transurban explicitly frames customer value through travel-time savings, and Ferrovial's managed-lane data show revenue per transaction rising far faster than general inflation on several assets.[1][3]
That counterweight is real. It is also why the sector deserves to be valued differently from ordinary infrastructure yield. The best toll roads are local monopolies with a service-quality proof point: the untolled alternative is slower, less reliable, or less convenient. When that remains true, tariff escalation is not just inflation recovery. It is a share of congestion value.
The stricter view is that this premium has to be earned corridor by corridor. A road with visible time savings, growing heavy-vehicle mix, and stable political relations deserves more credit than a road relying on formulaic toll increases into weak trips. The first is a scarce asset. The second is a regulatory debate waiting to happen.
Falsifier
The thesis fails if tariff mechanics alone keep producing durable EBITDA growth across the sector even when traffic mix is mediocre. If operators keep expanding margins through 2026 with flat-to-down trips, stable political relations, no material concession givebacks, and no evidence of driver substitution to free routes, then the market can pay more for inflation pass-through and less for traffic quality.
The thesis is confirmed if revenue growth keeps separating winners from weaker assets by mix: managed lanes with visible time savings and freight-heavy corridors hold pricing, while broad networks with weak heavy vehicles or affordability pressure show lower conversion from toll increases to cash flow.
Watchlist
First, watch Transurban's FY26 results after the June 30, 2026 year-end for post-opening performance on West Gate Tunnel, group ADT, toll revenue excluding new assets, and distribution coverage. The key test is whether new capacity adds clean traffic or mainly adds funding burden.[1]
Second, watch VINCI's 2026 traffic updates and half-year concession results for the split between light and heavy vehicles on French motorways. Heavy vehicles are the cleaner signal for trade-linked demand and pricing quality.[2]
Third, watch Ferrovial's 2026 Highways updates for the same managed-lane spread: transactions versus revenue per transaction on NTE, LBJ, NTE 35W, I-77, and I-66, plus 407 ETR vehicle kilometres traveled versus revenue per trip.[3][4]
Fourth, watch the FHWA monthly traffic releases through FRED. National VMT is not the valuation model, but a flattening driving tape would make local congestion and managed-lane value do more of the work.[5]
The practical conclusion is narrow. Toll roads deserve a premium when inflation pass-through meets real time savings and resilient traffic. They deserve less credit when the model is reduced to "raise the toll and collect the margin." In 2026, the multiple belongs to the operators that can prove the toll is still buying something drivers value.
Sources
- Transurban, FY25 Results Presentation (August 20, 2025) - proportional toll revenue, operating EBITDA, traffic growth, North America ADT, distribution guidance, and project pipeline.
- VINCI, "2025 full year results - Outstanding performance, record free cash flow" (February 5, 2026) - VINCI Autoroutes traffic, revenue, EBITDA margin, concession investment agreements, and 2026 outlook.
- Ferrovial, "Ferrovial reports strong full-year 2025 results, boosted by robust performance in all businesses" (CNMV filing, February 25, 2026) - Highways revenue, adjusted EBITDA, Express Lanes transaction and revenue-per-transaction trends, 407 ETR metrics, dividends, and pipeline.
- 407 International, "407 International Reports 2025 Results" (February 18, 2026) - 407 ETR revenue, EBITDA, trips, vehicle kilometres traveled, transponders, Route Relief Program, and 108-kilometre highway description.
- Federal Highway Administration via FRED, "Vehicle Miles Traveled" series TRFVOLUSM227NFWA (updated July 2, 2026) - monthly and moving 12-month U.S. vehicle miles traveled context.
- Wikimedia Commons, "File:Toll Plaza on Dulles Toll Road 1.JPG" - source page for the Dulles Toll Road toll-plaza photograph used as the article image.