Priced: Dollar General lifted the midpoint of its fiscal 2026 EPS guide by $0.575, and the market initially rewarded the raise.[1][3][4] New: only $0.25 of that increase is the estimated benefit from tariff refunds after reinvestment. The balance may reflect a better operating year, but it cannot all be called operating improvement because the revised outlook also introduces share repurchases.[1]
That distinction is the quarter. The refund made the headline margin unusually strong. Underneath it, however, customer traffic accelerated, every merchandise category grew, and inventory per store fell. Q2 therefore contains real evidence that Dollar General's recovery is becoming less dependent on price and excess stock. The remaining question is how much of that cleaner performance survives when the refund drops out and the EPS denominator starts moving.
Evidence cut-off: August 28, 2026. Midpoint changes below are simple calculations from company guidance, not company-provided adjusted measures. This is an earnings analysis, not a recommendation to buy or sell the shares.[1][3]
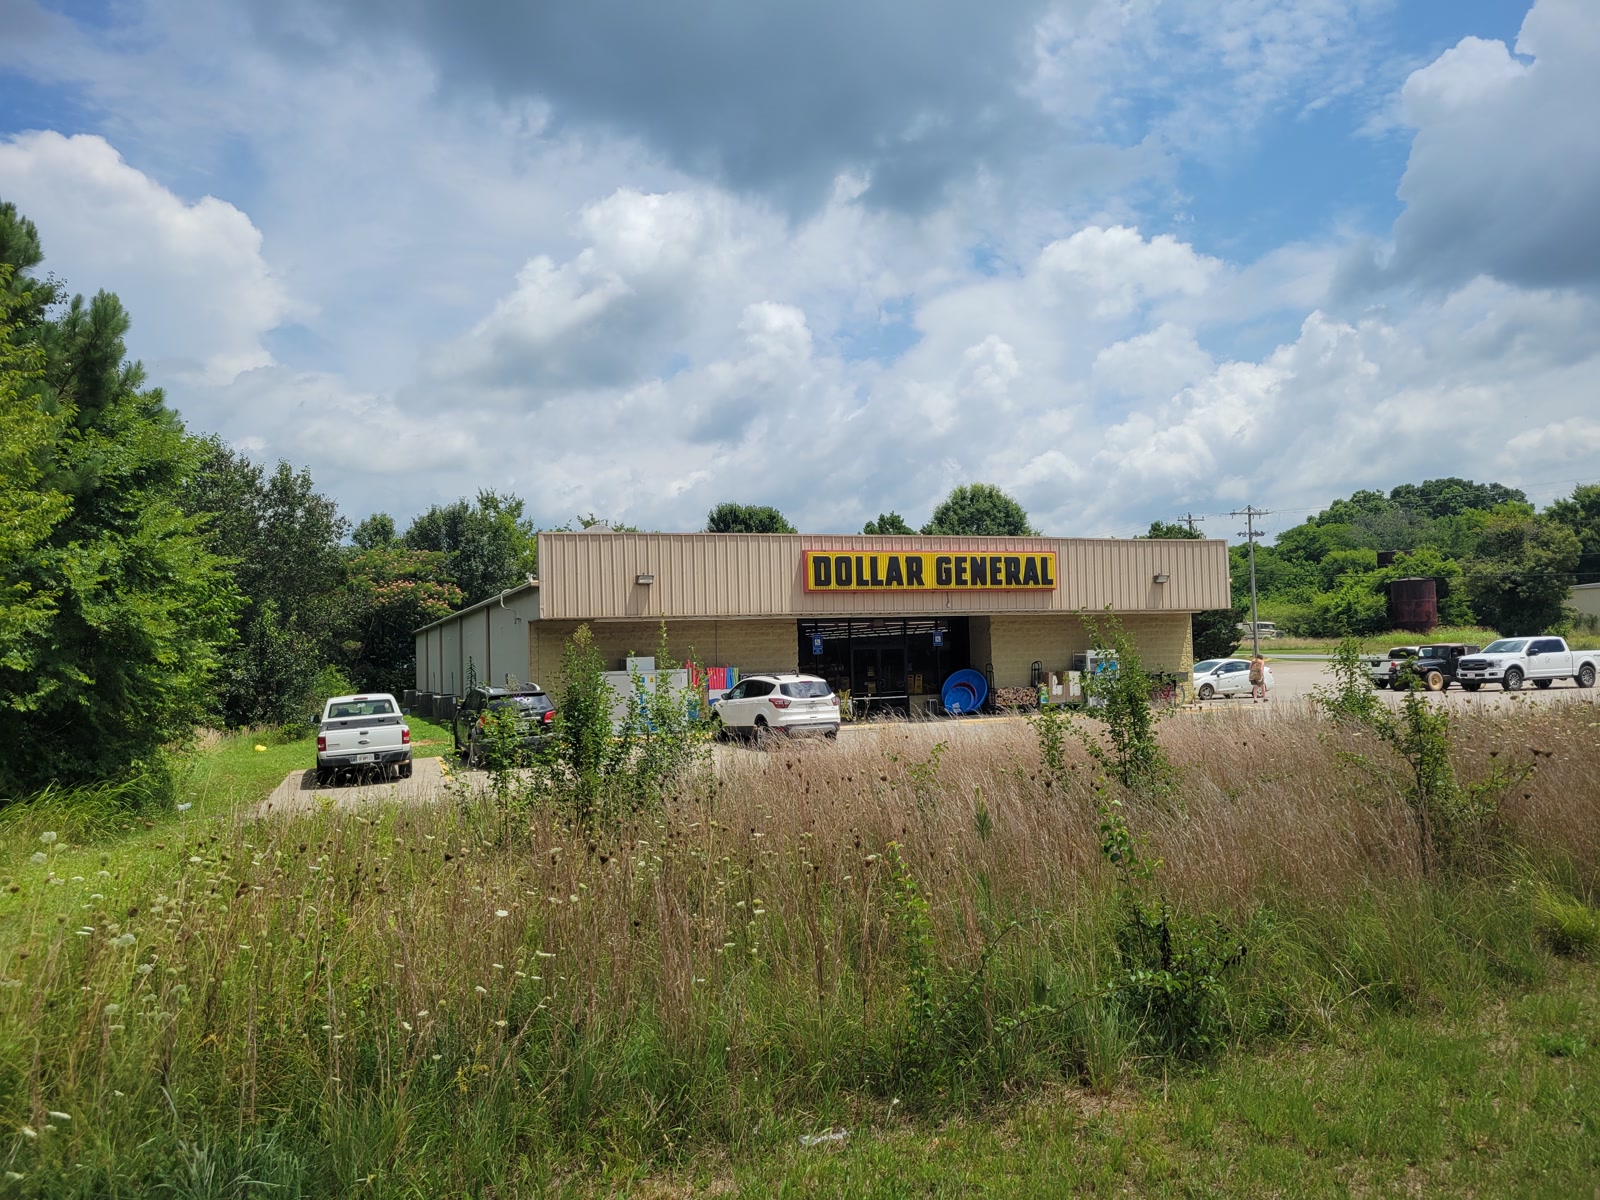
Image context: the cover photograph shows an actual Dollar General store in rural Gordon County, Georgia, in June 2026. It does not document a specific Q2 transaction. It does show the physical unit at the center of this analysis: a small-box storefront where traffic, basket size, inventory availability, and remodel productivity have to convert guidance into cash.[9]
The raise is larger than the refund
Six figures constrain this reading: the $0.575 EPS-midpoint increase; the $0.25 refund benefit; 127 basis points of gross-margin expansion; the refund's 81-basis-point contribution to that expansion; 3.5% same-store-sales growth; and a 2.7% decline in inventory per store.[1][2][3] The first pair explains why the guidance headline needs a bridge. The other two pairs test whether the stores improved underneath it.
The arithmetic tempts a neat conclusion: subtract the refund benefit from the midpoint increase and call everything left an operating upgrade. That would be too clean. The prior guide assumed no repurchases; the revised guide permits them in the second half. Buybacks can lift EPS by reducing weighted-average shares even when net income is unchanged. Dollar General did not publish a bridge allocating the residual among operating assumptions, financing effects, and the prospective share-count change.[1][3]
The better reading is narrower. The refund does not explain the whole raise, but the unallocated balance is not proof of operating improvement. Sales, traffic, gross margin, and inventory—not EPS alone—have to decide whether the business itself improved.
The refund bought 81 basis points; the quarter produced 127
Q2 gross margin expanded 127 basis points year over year. Dollar General estimates that tariff refunds, after it reinvested a substantial portion through promotions and lower everyday prices, supplied approximately 81 basis points of that expansion.[1][2]
The balance is not an official “organic margin” measure. It mixes lower distribution costs and a lower LIFO provision with higher markdowns and transportation expense. It is nevertheless useful as a boundary: the refund explains most of the gross-margin improvement, not all of it. SG&A's share of sales held steady and operating profit rose.[1]
There is also a pre-refund control quarter. In Q1, gross margin had already expanded before tariff refunds entered the reported driver list. The company attributed that gain primarily to higher inventory markups and lower shrink and damages, partly offset by markdowns and transportation costs.[3] Q2 did not invent the recovery; it temporarily amplified it.
The mechanism is therefore short. Better inventory handling and distribution lower the cost of putting goods on a shelf. Promotions funded with refund cash sharpen the value proposition. More customer visits spread fixed store costs across a larger sales base. Lower net interest expense then lets more operating profit reach earnings. The refund accelerated each reported layer, but only the operating pieces can repeat.[1][3]
Traffic and inventory are the cleaner pair
Same-store sales rose 3.5%. Both customer traffic and average transaction increased, and each reported merchandise category grew.[1] That is better-quality growth than a result driven only by price or by one grocery aisle.
Inventory provides the cross-check. Inventory per store fell 2.7% year over year while comparable sales rose.[1][2] That combination is consistent with faster stock productivity. It does not prove that every shelf was well supplied, and a single quarter cannot establish a durable turn-rate gain. It does reduce the chance that sales were purchased by simply loading more goods into each store.
The macro backdrop makes the traffic signal more important. July U.S. retail and food-services sales were higher than a year earlier, but the Census series is nominal and not adjusted for price changes.[5] Food-at-home and gasoline prices were also higher over the same period.[6] Reuters reported that budget pressure was steering shoppers toward cheaper groceries and everyday goods at discount chains.[4]
That national series is context, not a like-for-like benchmark for Dollar General: its period, store base, and product mix differ. Positive traffic inside existing stores is the more discriminating evidence. It says more transactions occurred, even if inflation and trade-down helped determine where they occurred.[1][5]
The buyback improves EPS—and muddies the proof
The company generated positive operating cash flow in the first half while continuing to invest in property and equipment. It also ended Q2 with cash on hand and unused repurchase authorization.[1][2] That gives the board room to fund the newly announced buyback while continuing a broad program of openings, remodels, relocations, and other real-estate projects.[1]
This is a legitimate use of excess cash if the shares are attractive and store investment is fully funded. It is not evidence that store economics improved. The next earnings recap should therefore keep two ledgers: net income before the share-count effect, and EPS after it. If both rise, the buyback reinforces operating progress. If EPS rises while operating income stalls, the denominator has taken over the story.
The strongest counterweight is a favorable discount cycle
Dollar General is executing better at a moment when household pressure naturally pushes traffic toward value retailers. High gasoline costs can squeeze discretionary purchases while still increasing the appeal of a nearby small-box store; food inflation can raise the ticket without creating real unit growth. The result may be both well executed and cyclically assisted.[4][5][6]
There are company-specific offsets too. Q2 margin still absorbed higher markdowns and transportation costs, and management says the refund should not have a material second-half impact after reinvestment.[1][2] The network also has to digest hundreds of openings and thousands of remodels without reversing the inventory improvement. Those are harder tests than receiving cash already paid to customs authorities.
The thesis here is not that a one-time refund has created a new earnings base. It is that traffic, category breadth, and inventory discipline show an operating recovery underneath the refund. Falsify that view if the next quarterly report shows non-positive customer traffic and inventory per store no longer declining year over year. Together, those outcomes would say Q2's cleaner sales-and-stock relationship did not persist once the temporary benefit rolled off.
Watchlist
- September 11 — August CPI: watch food-at-home and gasoline inflation. Slower pressure would test whether Dollar General can retain traffic when the household trade-down impulse eases; continued pressure could support visits while damaging discretionary mix.[6][8]
- September 16 — August retail sales: compare general-merchandise momentum with Dollar General's raised same-store-sales range, remembering that the Census series is nominal and covers establishments rather than a fixed product basket.[5][7]
- Fiscal Q3 results: separate gross-margin drivers after management's stated refund benefit becomes immaterial, then check traffic, inventory per store, operating income, and actual repurchase activity against the falsifier.[1][2]
- January 29, 2027 — fiscal year-end: test the annual EPS target alongside the real-estate plan and capital budget. Hitting EPS through a lower share count would not substitute for delivering the sales and store-productivity assumptions.[1]
Sources
- Dollar General, “Dollar General Corporation Reports Second Quarter 2026 Results” (August 27, 2026) — Q2 sales, traffic and ticket, margins, refund estimates, inventory, cash flow, repurchases, guidance, and real-estate plan.
- Dollar General, Quarterly Report on Form 10-Q for the quarter ended July 31, 2026 — refund timing and reinvestment, margin drivers, balance sheet, inventory, cash, obligations, and risk boundaries.
- Dollar General, “Dollar General Corporation Reports First Quarter 2026 Results” (June 2, 2026) — prior guidance, no-repurchase assumption, Q1 gross-margin bridge, shrink, damages, and traffic baseline.
- Reuters, “Dollar Stores Beat Sales Estimates As Cheaper Essentials In Demand” (August 27, 2026) — initial market reaction and discount-retail trade-down context.
- U.S. Census Bureau, “Advance Monthly Sales for Retail and Food Services, July 2026” (August 14, 2026) — nominal national retail-sales change and measurement boundary.
- U.S. Bureau of Labor Statistics, “Consumer Price Index — July 2026” (August 12, 2026) — food-at-home, gasoline, and broader consumer-price changes.
- U.S. Census Bureau, “Release Dates for 2025/2026” — September 16 publication date for August 2026 advance retail sales.
- U.S. Bureau of Labor Statistics, “Schedule of Selected Releases for September 2026” — September 11 publication date for August 2026 CPI.
- John Phelan, “Dollar General, Gordon County Georgia” (photographed June 27, 2026), Wikimedia Commons — source page for the documentary storefront photograph.