Container leasing is priced as a shortage trade, but the new issue is not simply whether freight rates spike again. The better 2026 question is whether lessors can keep cash returns intact while new container prices stay low enough to tempt shipping lines to buy their own boxes.
The old bull case was cleaner. Disrupted routes, slower container turns, and sudden trade surges made leased equipment valuable because liners needed boxes before factories and repositioning networks could catch up. The harder setup now is more two-sided. Freightos flagged June 2026 spot-rate pressure and also noted that empty repositioning has become a large drag on container mileage, with one in three containers moving without cargo and repositioning absorbing 30% of global TEU-miles.[4] That kind of imbalance can create temporary lease demand. It can also leave the wrong equipment in the wrong places, adding cost before it adds margin.
The Mechanism
A container lessor makes money by buying standardized steel boxes, leasing them to shipping lines, financing the fleet, and then selling or redeploying equipment as leases roll. The accounting looks like equipment rental, but the cycle behaves like logistics credit. A box can be technically fungible and still economically scarce if it is in the wrong port, the wrong condition, or the wrong lease term.
Triton is the cleanest public filing window into the model because it is the world's largest intermodal container lessor and is now a Brookfield Infrastructure portfolio company. Its investor page says more than 7 million TEUs of fleet are carried by major shipping lines, and its annual report describes a business built around acquisition, leasing, re-leasing, and sale of intermodal containers and chassis.[2] That scale matters because the advantage is not just cheaper procurement. It is fleet density, customer reach, depot access, financing durability, and the ability to absorb uneven drop-offs.
The priced part is that utilization still looks high. Triton's Q1 2026 filing reported average utilization of 97.1% and ending utilization of 97.3%.[1] Those numbers argue against a simple bear case that says the post-pandemic container cycle is over. A lessor can have weak spot lease rates and still harvest cash from a book of multi-year leases if the fleet remains on hire.
The new pressure sits in replacement economics. Triton said low new container prices were creating several headwinds: lower market lease rates, pressure on used container sale prices, and a customer preference to buy rather than lease many new additions.[1] That is the key finance distinction. A container shortage helps the lessor only if the customer needs quick access more than it values ownership. If factories quote attractive newbuild prices and liners have balance-sheet room, the incremental demand can bypass lessors.
Six Anchors
First, Triton's Q1 revenue fell to $312.2 million from $383.0 million a year earlier, while net income declined to $106.4 million from $144.8 million.[1] The company was still profitable, but the direction shows that high utilization does not fully protect earnings when lease rates and disposal gains soften.
Second, revenue earning assets stood at about $9.0 billion at March 31, 2026.[1] This is an asset-heavy spread business, not a pure software-style toll. The fleet has to earn more than depreciation, interest, repositioning, storage, repair, and disposal costs.
Third, Triton reported that 92.7% of total debt was fixed-rate or synthetically fixed through swaps.[1] That reduces the short-rate shock risk, but it does not remove refinancing, spread, or asset-value risk. Financing discipline buys time; it does not make weak lease rates irrelevant.
Fourth, the annual report says the large majority of Triton's containers are on multi-year long-term leases, which explains why utilization and cash flow can lag spot-market weakness rather than collapse with it.[2] This is also why the thesis should be measured across renewal waves, not a single freight-rate headline.
Fifth, Drewry's 2026/27 container census and leasing product tracks fleet ownership, production, newbuilding prices, resale prices, rental prices, long-term lease rates, and investment returns.[3] The fact that all of those variables sit in one specialist market forecast is the point: the lease rate is an output, not the whole model.
Sixth, the Port of Los Angeles says 39.8 million TEUs of U.S. international containerized imports and exports moved through U.S. seaports in 2025, with Los Angeles at 17% and the combined Los Angeles/Long Beach complex at about 31% of that waterborne container trade.[5] The asset may be global, but U.S. gateway concentration means a few chokepoints can still change turn times, repositioning costs, and practical box availability.
What Has To Go Right
The upside case is not "freight rates go up." It is narrower. Lessors need enough route disruption and trade growth to keep utilization high, but not so much newbuild enthusiasm that liners buy around them. They need high enough replacement cost to support lease rates and used-container sale values, but not so high that customers resist additions. They need debt costs contained, but also enough asset churn to recycle capital into equipment that will earn acceptable lease terms.
That balance is why container leasing can be more attractive than container shipping at certain points in the cycle. A liner is exposed to voyage rates, fuel, network reliability, vessel capacity, and customer contract resets. A lessor is exposed to the box layer: utilization, lease duration, counterparty credit, residual value, and funding. When the market is chaotic, lessors can be paid for speed and availability. When the market is merely oversupplied, they can be stuck defending renewals against cheap new equipment.
The practical underwriting question is therefore whether 2026 demand is emergency demand or replacement demand. Emergency demand pays for access. Replacement demand shops price. Freightos' signal about empty-box movements supports the idea that equipment friction remains real.[4] Triton's Q1 comments about low new container prices support the offsetting idea that customers can respond by purchasing rather than leasing.[1] Both can be true at once, which is why the stock-like read through Brookfield Infrastructure or preferred securities is more complex than a simple shortage headline.
Counterweight
The strongest pushback is that the lessor book is more resilient than the spot market suggests. Triton still had high utilization, large revenue earning assets, positive operating cash flow, and a heavily fixed or hedged debt stack in Q1 2026.[1] Multi-year leases mean a weak new transaction market takes time to flow through the income statement. If low newbuild prices discourage aggressive procurement, lessors can also preserve capital instead of chasing volume.
There is also a portfolio argument. Brookfield Infrastructure owns Triton as part of a broader infrastructure platform, and Triton's scale gives it customer access that smaller owners cannot easily copy.[2] The container is standardized; the platform around it is not. In a fragmented repositioning problem, scale can be a genuine edge.
The bear case is that scale does not protect marginal economics forever. If liners keep buying boxes because factory prices are low, then lessors face weaker additions, softer extension rates, and lower disposal proceeds. A 97% utilization figure can look comforting while the forward return on new capital is already deteriorating.
Falsifier
The thesis fails if new container prices stay low, liners continue to favor ownership, and Triton's utilization slips while extension rates and disposal prices weaken for more than one or two quarters. In that branch, container leasing is not a shortage trade. It is an asset-heavy business slowly repricing a pandemic-era fleet into lower marginal returns.
The thesis improves if the opposite happens: utilization remains near current levels, used-container prices stabilize, newbuild prices stop pressuring lease rates, and empty-box repositioning keeps liners willing to rent flexibility instead of owning every incremental unit.[1][3][4]
Watchlist
- Triton's next quarterly utilization and disposal gains: high utilization with improving sale proceeds would show that the asset floor is firming.[1]
- New container prices and long-term lease rates: Drewry's equipment forecasts are the cleanest specialist lens on whether the marginal box is getting better or worse for lessors.[3]
- Empty-container repositioning: persistent empty mileage supports tactical lease demand, but only if it converts into paid access rather than unrecovered logistics cost.[4]
- U.S. gateway throughput: Los Angeles and Long Beach remain useful real-world checks on whether container flow is becoming smoother or more congested.[5]
The investment read is deliberately narrow. Container leasing is not a pure freight-rate bet and not a generic global-trade proxy. It is a spread trade on box availability, fleet age, customer lease-versus-buy behavior, and financing discipline. The market can still reward the model, but only if newbuild discipline turns shortage headlines into durable cash rather than another round of cheap steel chasing the same routes.
Sources
- Triton International, Form 6-K for March 31, 2026 - Q1 2026 revenue, utilization, asset base, debt profile, and market commentary.
- Triton International, 2025 Annual Report on Form 20-F - company scale, Brookfield ownership context, long-term lease structure, and container-leasing risk factors.
- Drewry, "Container Census & Leasing and Equipment Forecaster 2026/27" - scope of fleet, production, lease-rate, resale-price, and investment-return coverage.
- Freightos, "Freightos Baltic Index (FBX): Freight Rate Container Price Index" - June 2026 container-market event notes, empty-container imbalance, and FBX context.
- Port of Los Angeles, "Facts and Figures" - 2025 U.S. seaport containerized trade volume and Los Angeles/San Pedro Bay market shares.
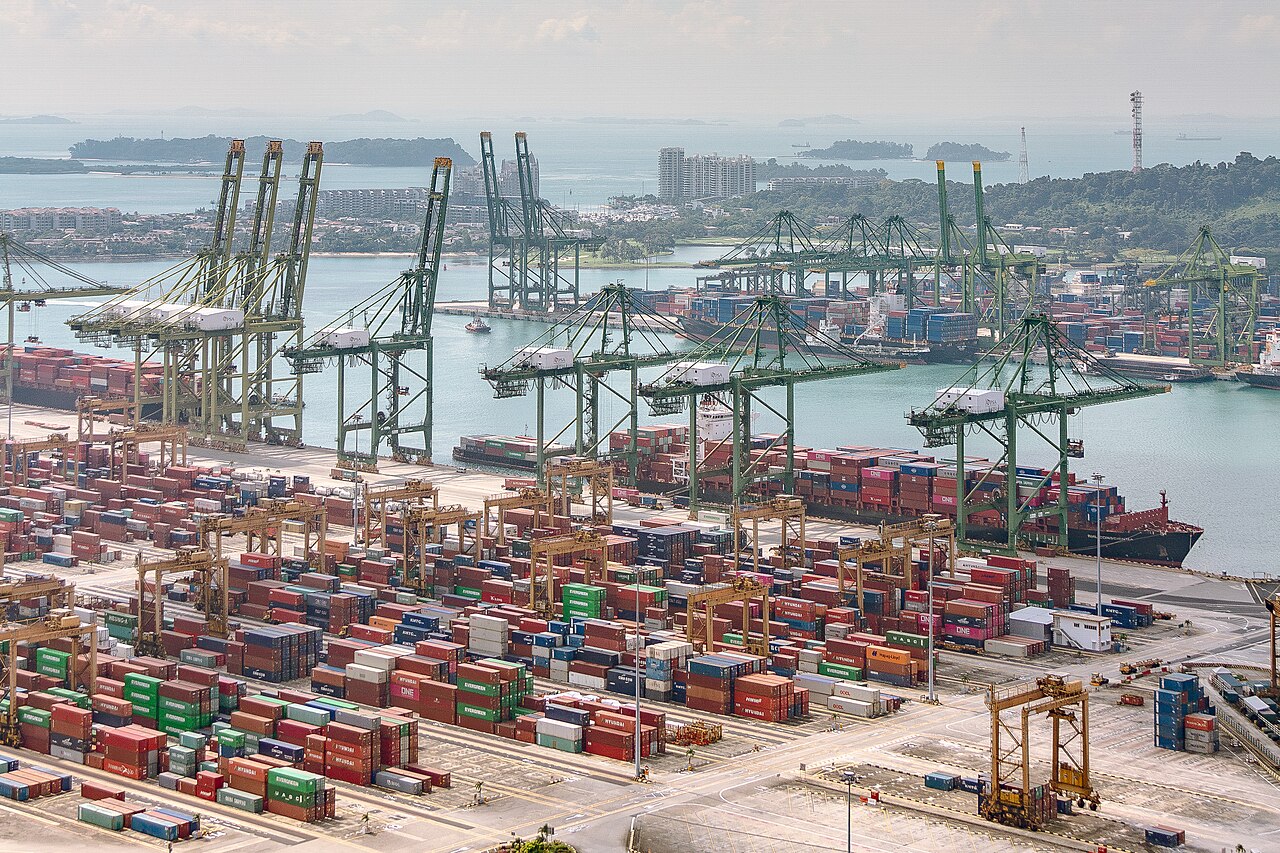
- Wikimedia Commons, "File:Port of Singapore.jpg" - photograph of container yards and cranes at the Port of Singapore by Aaaatu.