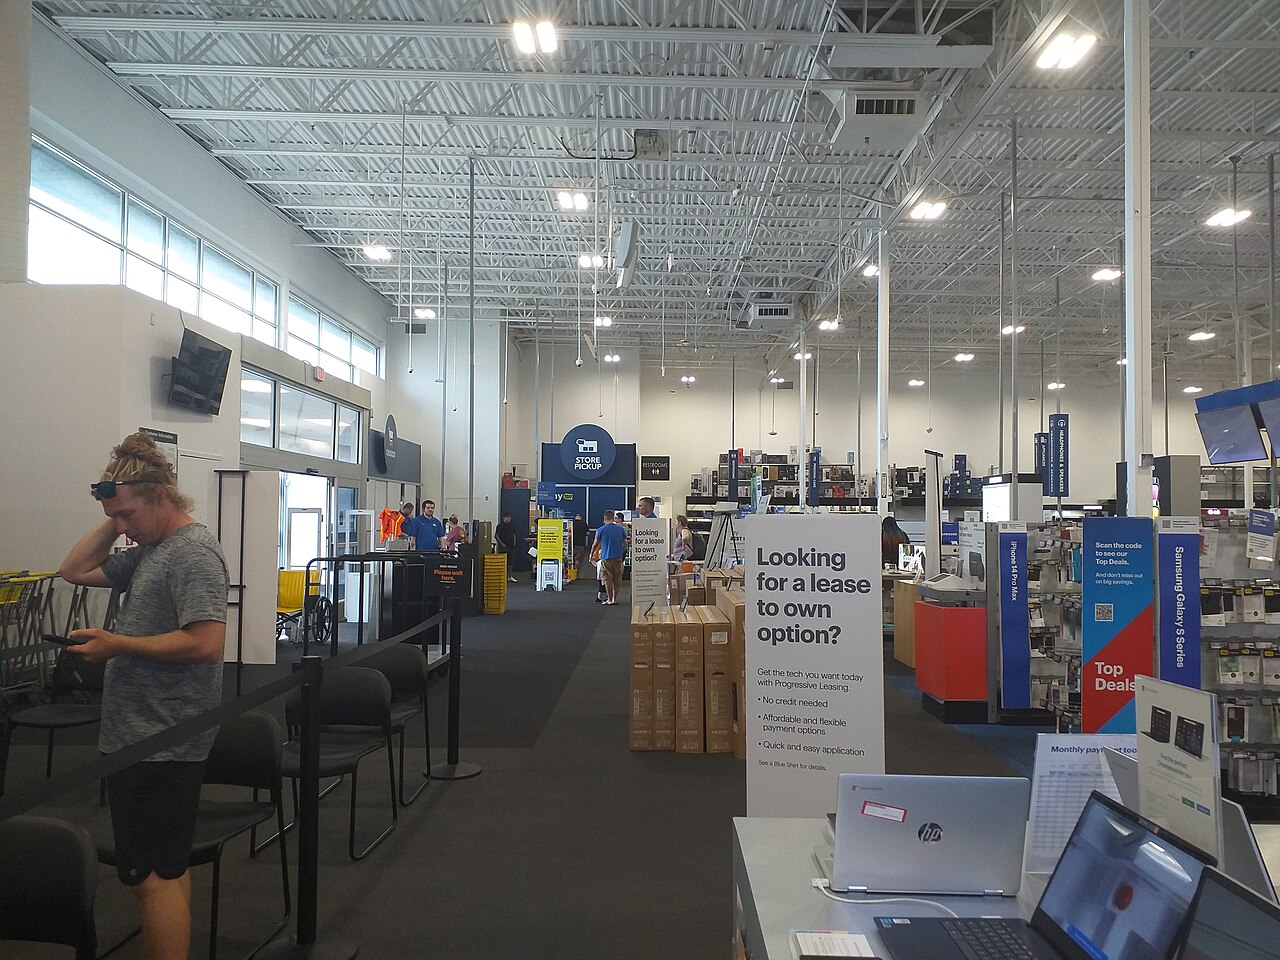
Priced: at the August 28 close of $82.44, Best Buy trades at about 12.1 times the midpoint of management's raised fiscal 2027 adjusted EPS guidance. New: the second quarter proved that demand can recover, but it did not yet prove that the margin gain belongs entirely to the operating model: a $34 million tariff refund sat inside the same gross-profit bridge as Best Buy Ads and Marketplace, and management's annual guide assumes a similar refund in Q3.[1][4][6]
That leaves a cleaner valuation question than “Is consumer electronics back?” The shares already recognize a better year. What they do not yet price is a durable shift from a thin-margin product retailer into a retailer that can earn more from advertising, marketplace commissions, memberships, and services without letting the cost of those initiatives consume the mix benefit.
Evidence cutoff: August 29, 2026. Reported figures come from Best Buy's filings and earnings release; management commentary comes from the company-hosted call transcript; the share price comes from end-of-day market data. The sensitivity below is an illustrative calculation, not a price target or individualized investment advice. Management's adjusted EPS outlook is a forecast, and Best Buy says it cannot reconcile that forward non-GAAP measure to GAAP without unreasonable effort because future adjustments are not predictable.[1][2][3][4][5][6]
The multiple says “prove the mix,” not “rescue the box”
Best Buy's fiscal 2026 baseline was stable rather than exciting: revenue reached $41.7 billion and comparable sales rose 0.5%. The annual filing also describes the actual economic bundle behind those numbers: stores and e-commerce, Geek Squad and installation, memberships, private-label goods, vendor partnerships, Best Buy Ads, and the newer Marketplace.[2] The investment case is therefore not a choice between “stores” and “digital.” It is whether the same customer trip can produce several revenue streams while the inventory-heavy product sale still supplies traffic.
Management now guides fiscal 2027 revenue to $42.3 billion-$42.8 billion, comparable sales growth to 1.9%-3.0%, an adjusted operating margin of 4.4%-4.5%, and adjusted diluted EPS of $6.70-$6.90.[1] Those ranges describe a repaired year, not a high-growth company. At the $6.80 EPS midpoint, the August 28 close implies 12.1 times earnings. That is low enough to acknowledge cyclicality and narrow margins, but high enough that merely meeting the new guide should not create a large rerating by itself.
The quarterly dividend sharpens the point. At $0.96 per share, four equal payments would annualize to $3.84, or about a 4.7% yield at the current price.[1][4] The payout pays investors to wait, but it is not a substitute for earnings quality. It also consumes about 56% of the guided EPS midpoint, so the bull case cannot rest on pushing the dividend ever harder against a flat profit base.
The second quarter contained two different margin stories
The constructive story is real. Enterprise comparable sales rose 4.1%, adjusted diluted EPS increased to $1.47, and domestic growth extended across computing and mobile phones, consumer electronics, services, and several emerging categories.[1] Best Buy was not leaning on one launch or one appliance promotion. Online revenue also grew, while the store network continued to provide pickup, advice, installation, returns, and repair—functions that a pure marketplace has to reproduce or outsource.
There is also an important outside check on the enthusiasm. IDC estimated that worldwide PC shipments fell 4.9% year over year in the second calendar quarter as memory constraints raised prices, even while Best Buy reported strong computing and mobile-phone comparable sales.[5] The measures are not identical—global manufacturer shipments are not U.S. retail sell-through—but the divergence matters. Dollar sales can improve while units are less healthy if prices rise or the mix moves toward premium, AI-enabled devices. A valuation should not automatically capitalize one quarter of higher tickets as a new unit-growth cycle.
The margin bridge is even more revealing. Domestic gross margin rose to 24.0% from 23.4%. Best Buy attributed the improvement primarily to Marketplace and Ads growth plus the $34 million tariff refund, partly offset by lower product margin rates.[1] That refund was equivalent to roughly 37 basis points of domestic quarterly revenue. It did not necessarily flow dollar-for-dollar into operating income, but its scale explains why the headline 60-basis-point gross-margin improvement should not be treated as wholly recurring. Management also said its annual outlook assumes another IEEPA tariff refund in Q3 at roughly the same level, which means the guide itself still contains refund support.[6]
At the same time, domestic adjusted SG&A rose to 19.6% of revenue from 19.3%. Compensation, advertising, and spending on Marketplace and Best Buy Ads were among the drivers.[1] This is the mechanism investors need to watch: the new businesses can improve gross profit because ads and marketplace commissions carry little product inventory, yet building them also costs money. The recurring spread is what remains after both sides of that ledger are counted.
That is why the 4.4%-4.5% full-year adjusted operating-margin guide cannot, by itself, prove a better earnings mix. The outlook assumes a second refund; the clean test comes after that support ends. If Best Buy can then hold the margin range through Ads, Marketplace, memberships, and services, mix is doing real work. If not, the refunds bought time rather than a higher-quality earnings stream.[1][6]
A simple multiple sensitivity
A broad retail peer table would create more precision than insight. Best Buy itself cautions that retailers classify supply-chain costs differently between cost of sales and SG&A, limiting gross-margin comparisons.[2] Its mix of specialty inventory, vendor funding, service labor, memberships, advertising, and marketplace revenue is also unlike a general merchandiser's. The cleaner walkthrough holds management's $6.80 adjusted EPS midpoint constant and asks what three multiples would mean.
| Illustrative case | P/E on $6.80 | Implied value | What the multiple would be saying |
|---|---|---|---|
| Cycle fades | 10x | $68.00 | The fiscal 2027 guide is a temporary recovery; product margin and unit demand weaken again. |
| Guide holds | 12x | $81.60 | Low-single-digit comps and current margin persist, with the dividend doing much of the return work. |
| Mix compounds | 14x | $95.20 | Ads, Marketplace, memberships, and services lift recurring earnings quality enough to justify a modest rerating. |
These are not target prices. They isolate the debate. The current $82.44 price sits almost exactly on the 12-times branch, about 1% above its implied value. The 14-times branch offers roughly 15% upside before dividends, but it requires proof that is absent from a guide containing an assumed second refund. The 10-times branch implies roughly 18% downside if the market decides fiscal 2027 is the top of another replacement cycle.[1][4][6]
The strongest counterweight to this cautious reading is balance-sheet and operating resilience. At quarter-end, cash exceeded funded debt, the company retained a large North American store footprint, and the raised guide followed broad category growth rather than aggressive new-store expansion.[1][2] Best Buy does not need a dramatic turnaround to support the 12-times case. It needs execution: keep products relevant, monetize the traffic several ways, and prevent the added layers from bloating SG&A.
The falsifier
This “fairly priced, wait for mix proof” view is wrong if Q3 lands inside guidance and the first clean reporting window after management's assumed second refund still shows positive comparable sales and annualized operating margin at or above the fiscal 2027 range, while inventory grows no faster than sales and management identifies Ads, Marketplace, memberships, or services as the recurring margin contributors.[1][6] That sequence would demonstrate that the latest quarter was the start of a better profit structure, not simply a good demand print with reimbursement support. In that event, the 14-times branch would deserve more weight.
What to watch next
- The fiscal Q3 2027 release: management has guided comparable sales to 1%-3% and adjusted operating margin to 4.1%-4.2%, while assuming another tariff refund similar to Q2's. The key read is how much margin remains after separating that reimbursement, not just whether revenue lands inside the range.[1][6]
- November 1, 2026: Jason Bonfig is scheduled to succeed Corie Barry as CEO. Listen for whether the new leadership team treats Ads and Marketplace as gross-profit additions, cost-heavy growth bets, or both—and how it balances those investments against capital returns.[1][3]
- The holiday-quarter cash conversion: inventory stood above the prior-year level at the end of Q2. The clean outcome is sales growth absorbing those goods without markdowns or a working-capital build that makes the earnings recovery look less cash-generative.[1]
Best Buy's valuation is doing something sensible. It gives the company credit for a better fiscal year, a resilient store-and-service network, and a substantial dividend. It withholds the premium reserved for durable, capital-light growth. At roughly 12 times guided earnings, the stock is not asking whether the box survives. It is asking whether the profit made around the box can keep growing after the refund disappears.
Sources
- Best Buy Co., Inc., “Best Buy Reports Second Quarter Results” (August 27, 2026) — Q2 fiscal 2027 sales, category mix, margins, tariff refund, capital returns, guidance, and management commentary.
- Best Buy Co., Inc., Fiscal 2026 Form 10-K (filed March 18, 2026) — business mix, annual baseline, store network, risk factors, and retailer cost-classification caveat.
- Best Buy Co., Inc., Form 8-K (filed August 3, 2026) — CFO appointment and the November 1, 2026 CEO transition date.
- FinancialContent, “Historical Stock Prices for Best Buy (NYSE: BBY)” — August 28, 2026 closing-price record used in the valuation calculation.
- IDC, “PC Market Runs Low on RAM to Grow: Shipments Decline 4.9% as Memory Crunch Bites” (July 8, 2026) — worldwide PC shipment and component-cost context.
- Best Buy Co., Inc., Q2 Fiscal 2027 Earnings Call Transcript (August 27, 2026) — management commentary on category units and pricing, monthly comp cadence, and the similar Q3 tariff-refund assumption embedded in annual guidance.
- Hastengeims via Wikimedia Commons, “File:Best buy 2.jpg” (photographed August 6, 2023) — source page for the real in-store Best Buy photograph used as the hero image.